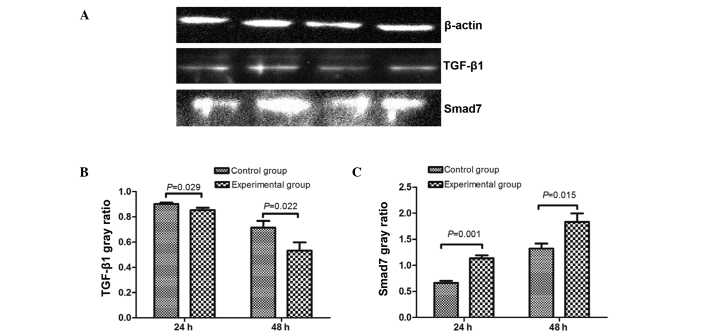
Figure 6.
The expression of TGF-β1 and Smad7 protein in the control and experimental groups. (A) TGF-β1 and Smad7 expression. From left to right: Control group at 24 h, experimental group at 24 h, control group at 48 h and the experimental group at 48 h. Quantification of the protein expression levels of (B) TGF-β1 and (C) Smad7. TGF-β1, transforming growth factor β1.

