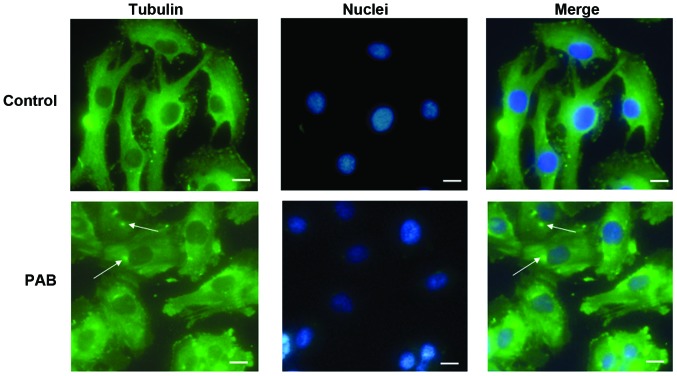
Figure 3.
α-Tubulin distribution analysis of PAB-treated SW579 cells by fluorescence microscopy. SW579 cells were treated with PAB (4 µM) for 24 h. Control cells were treated with dimethyl sulfoxide. Cells were fixed in 4% paraformaldehyde, and stained with anti-α-tubulin antibodies prior to being co-stained with fluorescein isothiocyanate-labeled secondary antibody and Hoechst 33258 (blue). Merged images of α-tubulin and DNA staining are presented. Arrows indicate aggregated α-tubulin. Data are representative of three individual experiments; n=3. Scale bar=15 µm. PAB, pseudolaric acid B.

