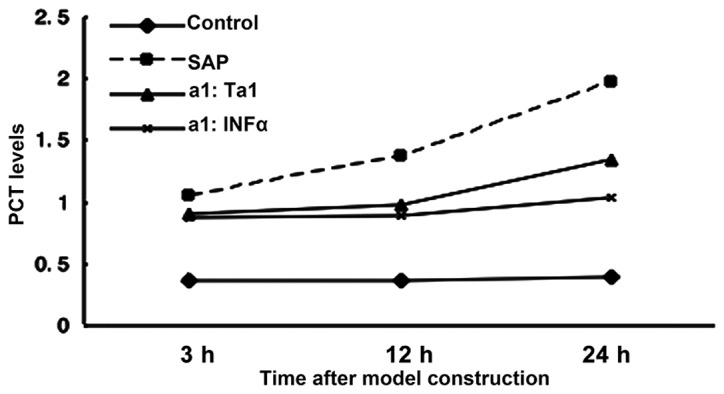
Figure 3.

Circulating levels of PCT in rats following SAP and subsequent Ta1 of INFα treatment. Blood samples were collected over the following 24 h. The levels of PCT were measured using ELISA. PCT, procaltitonin; SAP, severe acute pancreatitis; TA1, thymosin α1; IFNα, interferon α. P>0.05 for SAP group vs. Ta1 group at 3 h. P<0.05 for Ta1 group vs. SAP group at 12 and 24 h.
