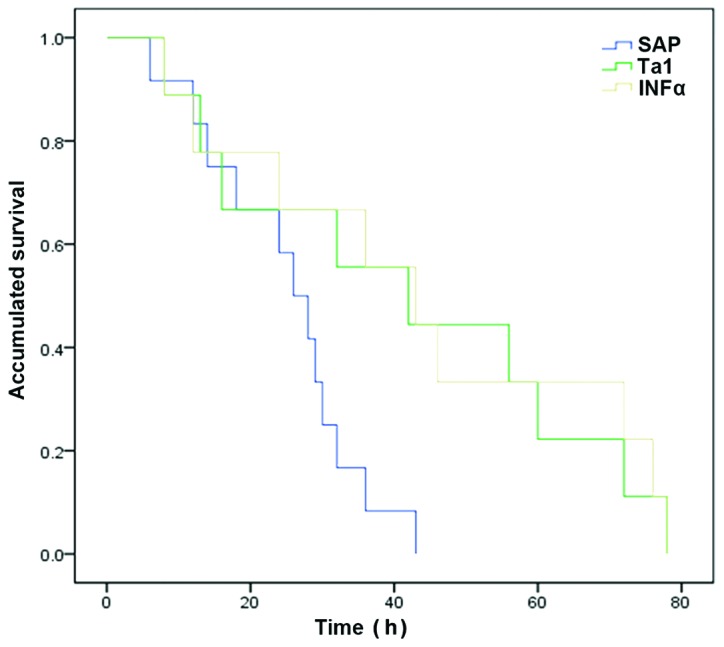
Figure 6.

Kaplan-Meier survival curves of the rats in the different treatment groups. SAP, severe acute pancreatitis; TA1, thymosin α1; IFNα, interferon α.

Kaplan-Meier survival curves of the rats in the different treatment groups. SAP, severe acute pancreatitis; TA1, thymosin α1; IFNα, interferon α.