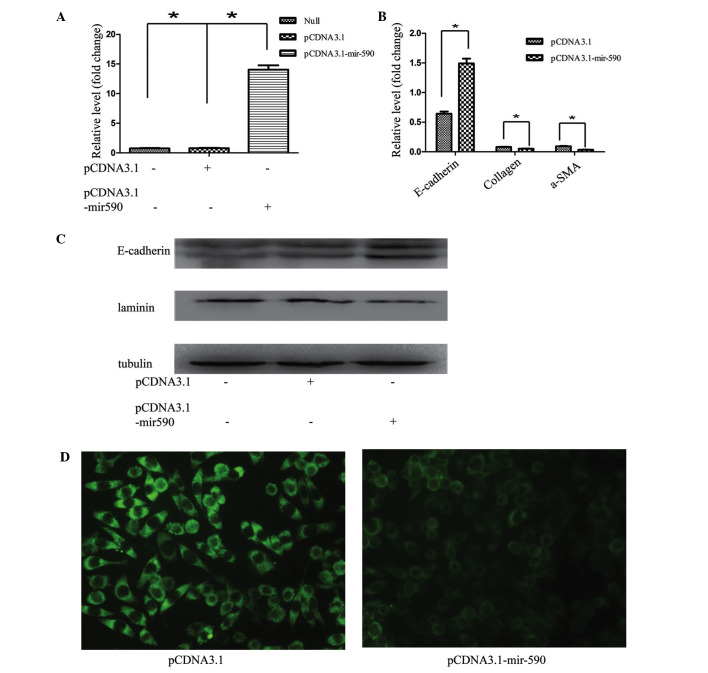
Figure 4.
Effects of miR-590 on EMT in HK2 cells. (A) Validation of the transfection efficiency in HK2 cells with pCDNA3.1-mir-590 or pCDNA3.1. (B) The mRNA expression levels of E-cadherin, collagen and α-SMA in HK2 cells 48 h following transfection with pCDNA3.1-mir-590 or pCDNA3.1. (C) The protein expression levels of laminin and E-cadherin 48 h following transfection with pCDNA3.1-mir-590 or pCDNA3.1. (D) The altered expression levels in HK2 cells following miR-590 overexpression, as measured by fluorescence. Magnification, ×400. The data are shown as fold changes compared with control cells. The data are presented as the mean ± standard deviation, and the results are representative of at least three independent experiments. *P<0.05, compared with the control. a-SMA, α-smooth muscle actin.

