
Figure 3.
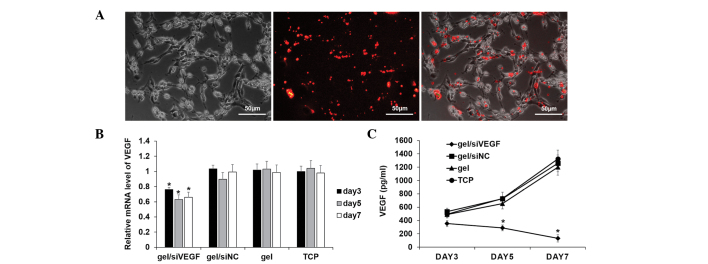
(A) Visualization of the uptake of siRNA using fluorescence microscopy. (B) mRNA expression of VEGF, determined using quantitative polymerase chain reaction analysis. (C) Associated VEGF protein level, determined by enzyme-linked immunosorbent assays. *P<0.05, compared with the other three control groups. Data are expressed as the mean ± standard deviation. siRNA, small interfering RNA; siNC, siRNA negative control; VEGF, vascular endothelial growth factor; TCP, tissue culture plate.