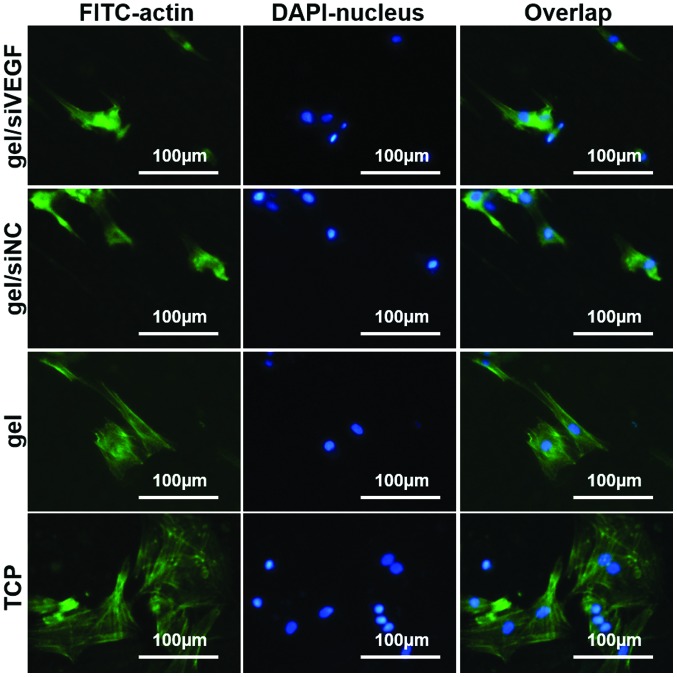
Figure 5.
Actin cytoskeleton staining of the 16HBE cells grown on different hydrogels. Data are expressed as the mean ± standard deviation. siRNA, small interfering RNA; siNC, siRNA negative control; VEGF, vascular endothelial growth factor; TCP, tissue culture plate; FITC, fluorescein isothiocyanate.

