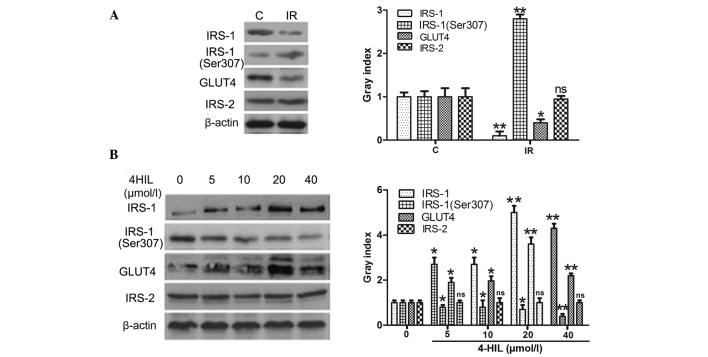
Figure 5.
Expression of insulin signal transduction proteins in IR HepG2 cells prior to and following exposure to different concentrations of 4-HIL. The left and right panels of A and B show western blotting and quantitative analysis of each band, respectively. (A) Expression of insulin signal transduction proteins in the control cells and IR HepG2 cells (*P<0.05 and **P<0.01 vs. control cells). (B) Expression of insulin signal transduction proteins in IR HepG2 cells exposed to different concentrations of 4-HIL (*P<0.05 and **P<0.01 vs. 0 µmol/l). 4-HIL, 4-hydroxyisoleucine; IRS-1/2, insulin receptor substrate 1/2; GLUT, glucose transporter type 4; C, control cells; IR, insulin-resistant cells; ns, not significant.

