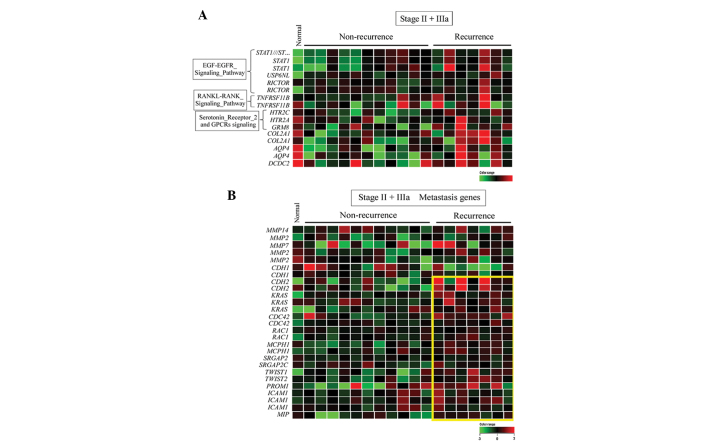
Figure 4.
Heat map representation of (A) pathway- and (B) metastasis-associated upregulated genes in early stage recurrent triple-negative breast cancer. Each row represents a gene and each column represents a patient. Early stage is defined as stages IIa, IIb and IIIa. Red indicates upregulation, green indicates downregulation and black indicates no change. The yellow box indicates genes that are upregulated in tumors with subsequent recurrence compared to those without. The expression ratios ranged between −3 and 3 on a log scale.

