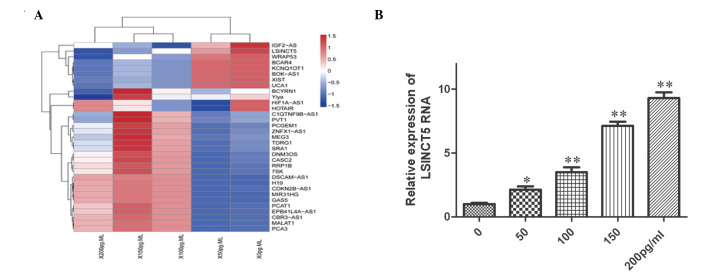
Figure 2.
Expression levels of LSINCT5 are the most significantly altered in HCM cells stimulated by BNP. (A) Heatmap analysis of lncRNAs in HCM cells treated with various concentrations of BNP was conducted using a method of hierarchical clustering by GeneSpring GX 7.3. Rows, samples; columns, lncRNAs. Color key indicates lncRNA expression value: Red, highest; blue, lowest. (B) mRNA expression levels of lncRNA LSINCT5 as determined by reverse transcription- quantitative polymerase chain reaction. lncRNA, long non-coding RNA; BNP, B-type-natriuretic peptide. *P<0.05; **P<0.01, compared with the 0 pg/ml group.

