Figure 4.

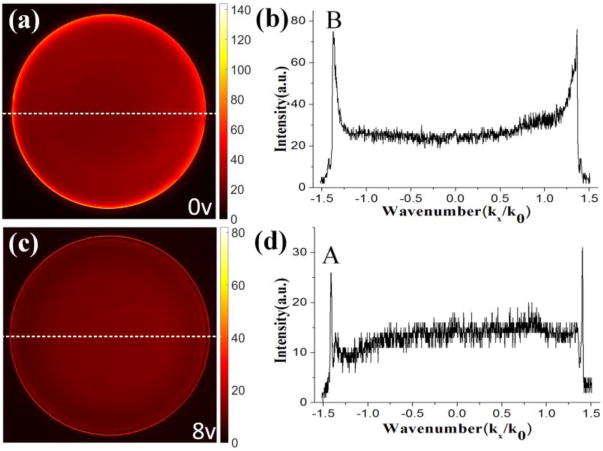
Fourier plane fluorescence images from Sample 2 with the voltage loaded on LC is 0 v (a) or 8 v (c). Profiles (b) and (d) are fluorescence intensity distribution along the white dash lines indicated in (a) and (c), respectively.

Fourier plane fluorescence images from Sample 2 with the voltage loaded on LC is 0 v (a) or 8 v (c). Profiles (b) and (d) are fluorescence intensity distribution along the white dash lines indicated in (a) and (c), respectively.