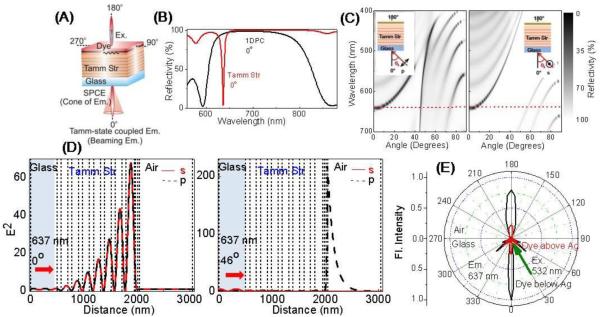
Figure 9.
(A) Schematic of coupled emission in Tamm structure. (B) Wavelength–dependent reflectivity dip in the Tamm structure vis-a-vis a 1DPC structure. (C) Calculated R(λ,θ) plots. (D) Electric field intensity simulations for Tamm–plasmon and surface–plasmon modes. (E) Experimental emission patterns in Tamm structure from nile blue located above (red line) and below (black line) the Ag layer.18

