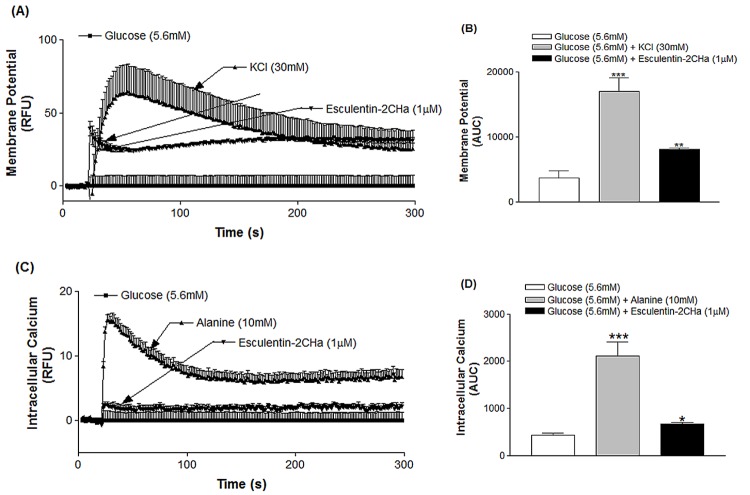
Fig 2. Effects of esculentin-2CHa on membrane potential (A, B) and intracellular calcium concentration (C, D) in BRIN-BD11 cells expressed as relative fluorescence unit, RFU (A, C) and area under the curve, AUC (B, D).
Cells were incubated with esculentin-2CHa (1 μM) or its substituted analogue and data were collected every 1.52 s over a period of 5 min. Values are mean ± SEM with n = 6. *P < 0.05, **P < 0.01, ***P < 0.001 compared with 5.6 mM glucose.

