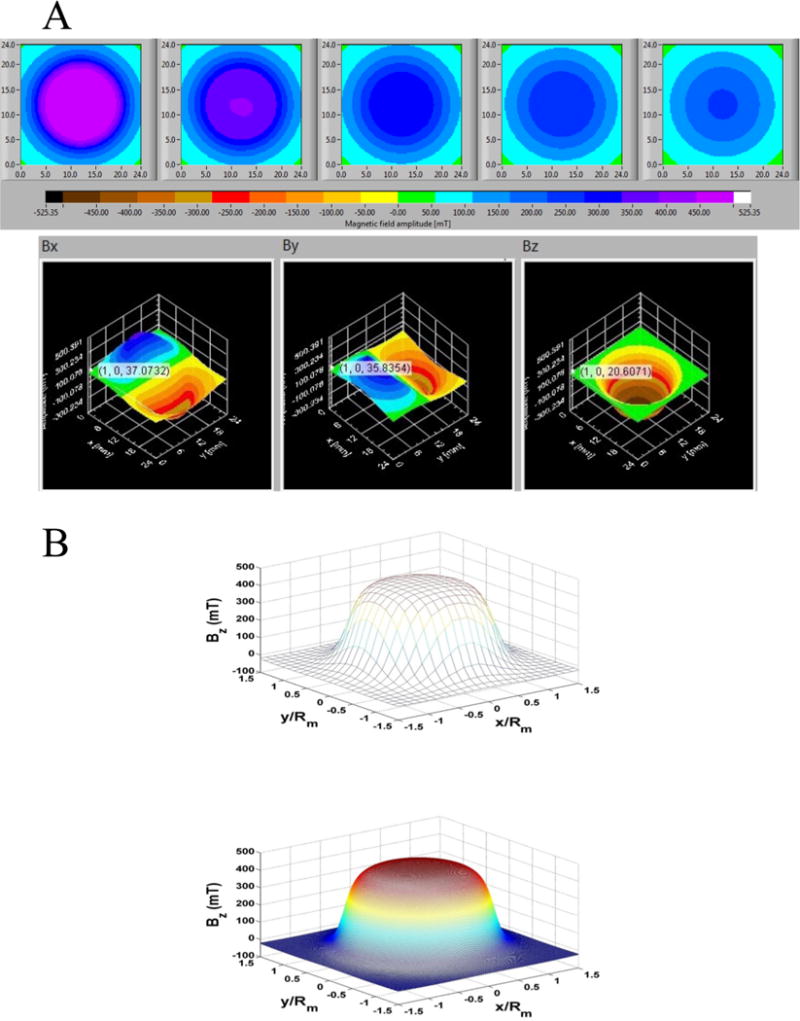
Figure 1.

(A) Measured field data from the SENIS 3D magnetic field mapping system. The top panel (from left to right) contains plots of Btotal over a 24 mm × 24 mm area at distance z = 1, 2, 3, 4, and 5 mm. The three plots in the bottom panel are (from left to right) the spatial distribution of the field components Bx, By, and Bz over a 24 mm × 24 mm area at a distance z = 1 mm above the magnet. (B) Analysis of Bz at z = 1 mm above the magnet: (top) measured data, (bottom) theoretical predictions.
