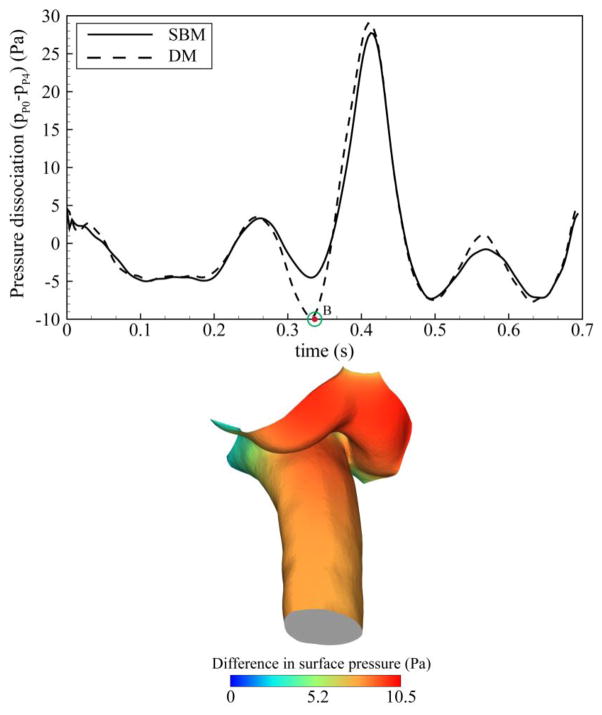
Figure 3.
Top: Pressure dissociation waveform obtained from baseline and dynamic models (ΔP is obtained between P0 and P4 planes as depicted in Figure 1) Bottom: Difference of the relative surface pressure between baseline and dynamic models at time point B showing the largest differences were present at the cerebellar tonsils.

