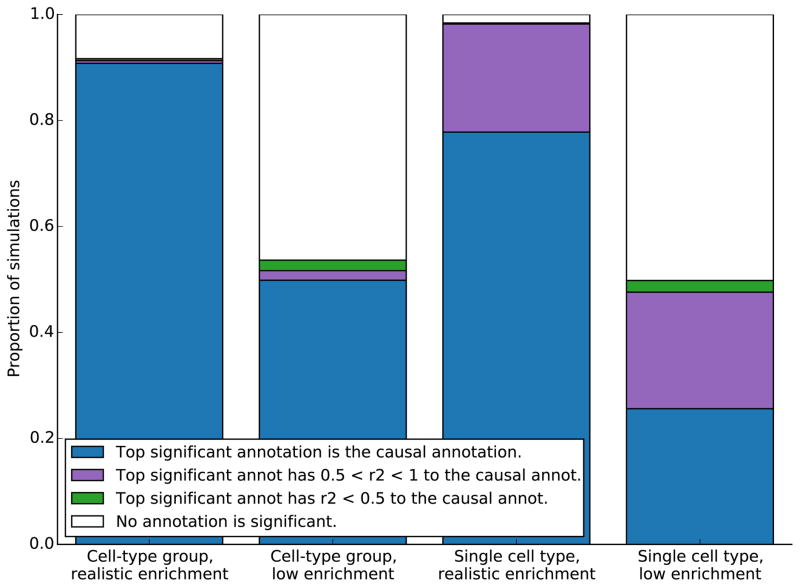
Figure 3.
Simulation results for ranking cell-type groups and cell types. For each cell-type group, 500 simulations were performed with baseline enrichment and either realistic enrichment or low enrichment in that cell-type group. Results for the left two columns are aggregated over the ten cell-type groups; results for individual groups are displayed in Supplementary Figure 5. The right two columns represent 500 simulations each of realistic or low enrichment of a single cell-type-specific annotation, H3K4me3 in fetal brain cells.

