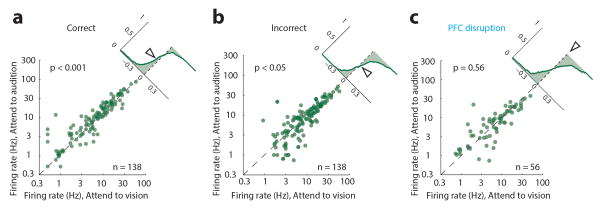
Extended Data Figure 6. Distinct visTRN firing rate changes in natural errors compared to PFC disruption.
Scatter plots showing the change in absolute firing rate for visTRN neurons for correct (a) incorrect (b) or PFC disrupted trials (c). Insets show the cumulative probability plot of separation from the unity line (no change). While correct trials had a lower firing rate in ‘attend to vision’ than ‘attend to audition’ (n = 138, p < 0.001 Wilcoxon Sign-Rank Test) this pattern was reversed for incorrect trials (n = 138, p < 0.05, Wilcoxon Sign-Rank Test) suggesting that perhaps the animal was attending to the wrong modality. This reversal was not observed in trials with PFC disruption (despite mouse performance being at chance level).

