
Figure 2. Fewer axons are present at the center of the cornea 28d after dulled blade and rotating burr wounds.
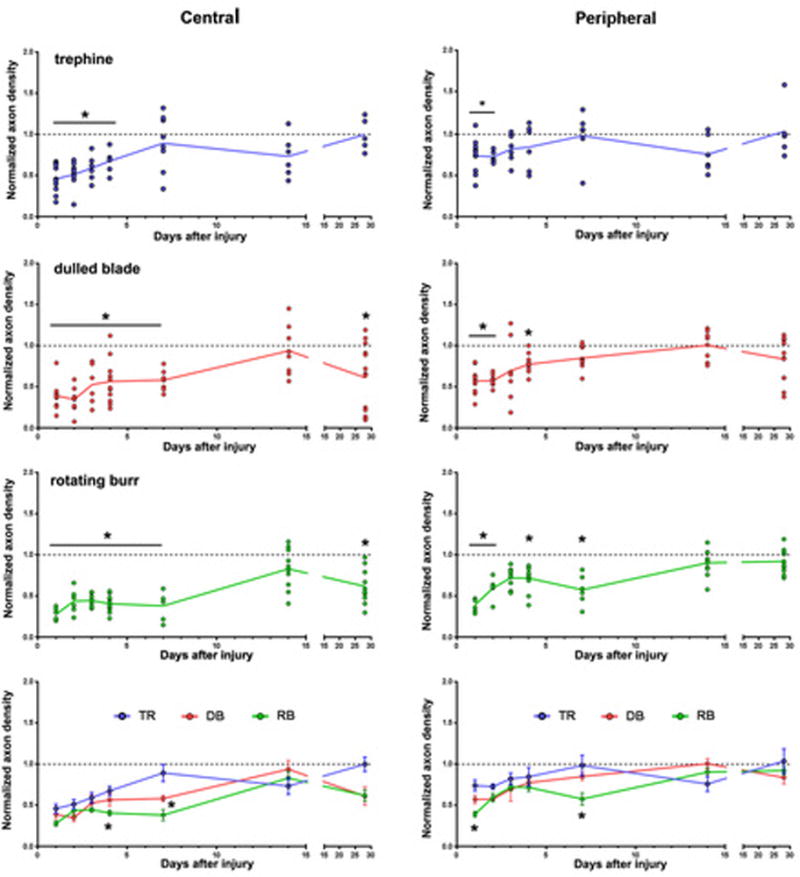
The density of axons at the center and periphery of the cornea was determined by Sholl analysis. Data are expressed as the number of intersections present at the corneal center (left) and the periphery (right) at 1d, 2d, 3d, 4d, 7d, 14d, and 28d after wounding relative to the numbers of intersections in unwounded control corneas. Scatter plots with trendlines are presented for trephine (blue), dulled blade (red) and rotating burr (green) wounded corneas; filled circles indicate data from individual corneas. The parallel grey line at the value of 1.0 indicates axon density in control. Data are compared using one-way ANOVA and p values less than 0.05 are considered significant. The graph at the bottom shows data from all three wound types plotted together to better visualize comparisons between wound types.