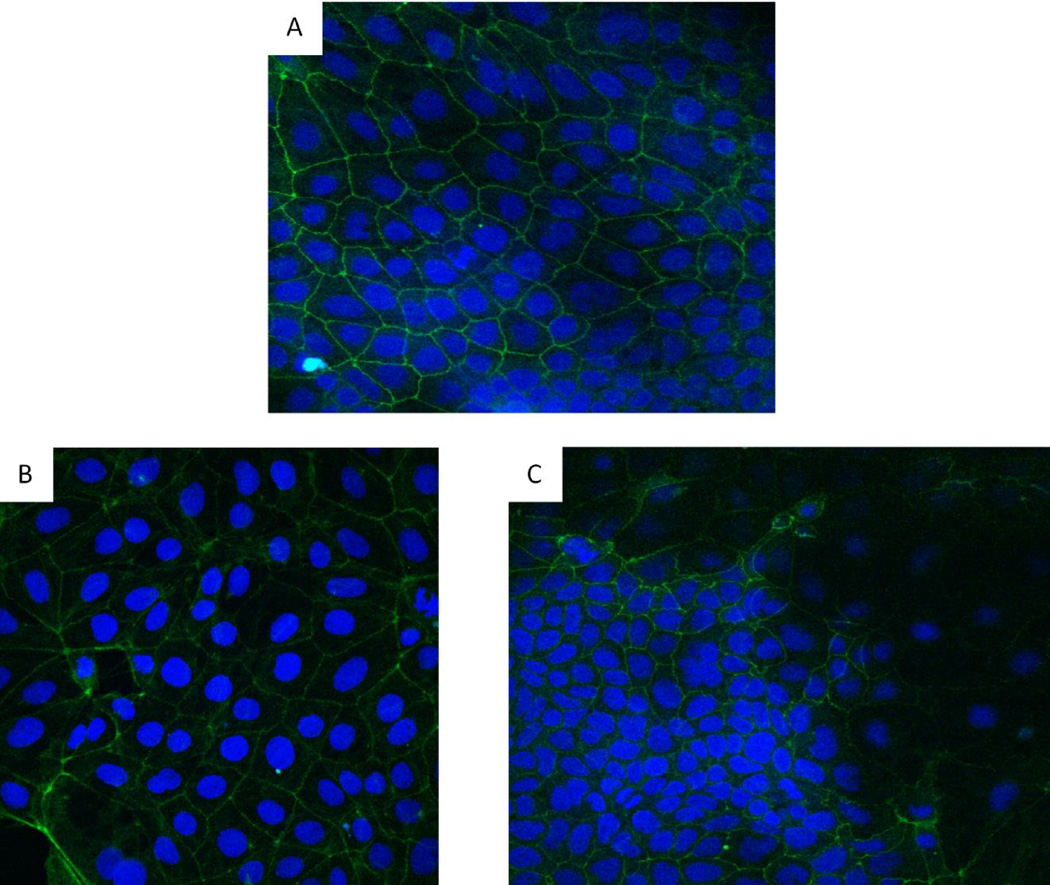
Figure 7.
Redistribution of tight junction protein ZO-1. Caco-2 cells were cultured for 5–7 days and stained for ZO-1 (Panel A). Panels B and C are Caco-2 cells treated with 30 micromolar olmesartan medoxomil for 30 minutes (B) or 4 hours (C). FITC conjugated anti ZO-1 and DAPI (blue) were used for staining. Magnification (40×). ZO-1 is depicted by green, and nucleic acid by blue.

