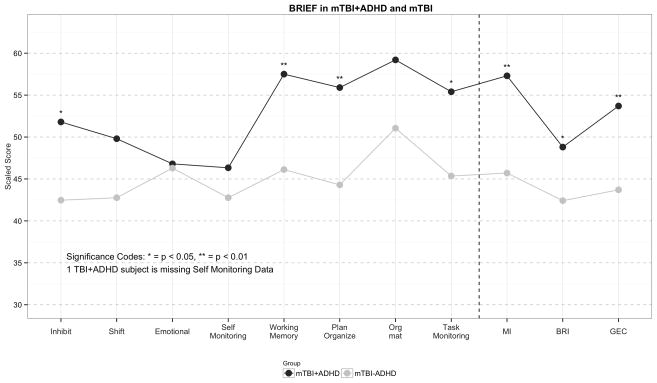
Figure 3.
Figure 3 compares the average scaled score for each BRIEF subscale score and each BRIEF composite score in subjects with mTBI and ADHD compared to mTBI subjects without ADHD. Higher scores suggest a higher level of executive dysfunction in the specific domain. The dashed line separates the subscale scores from the composite scores.

