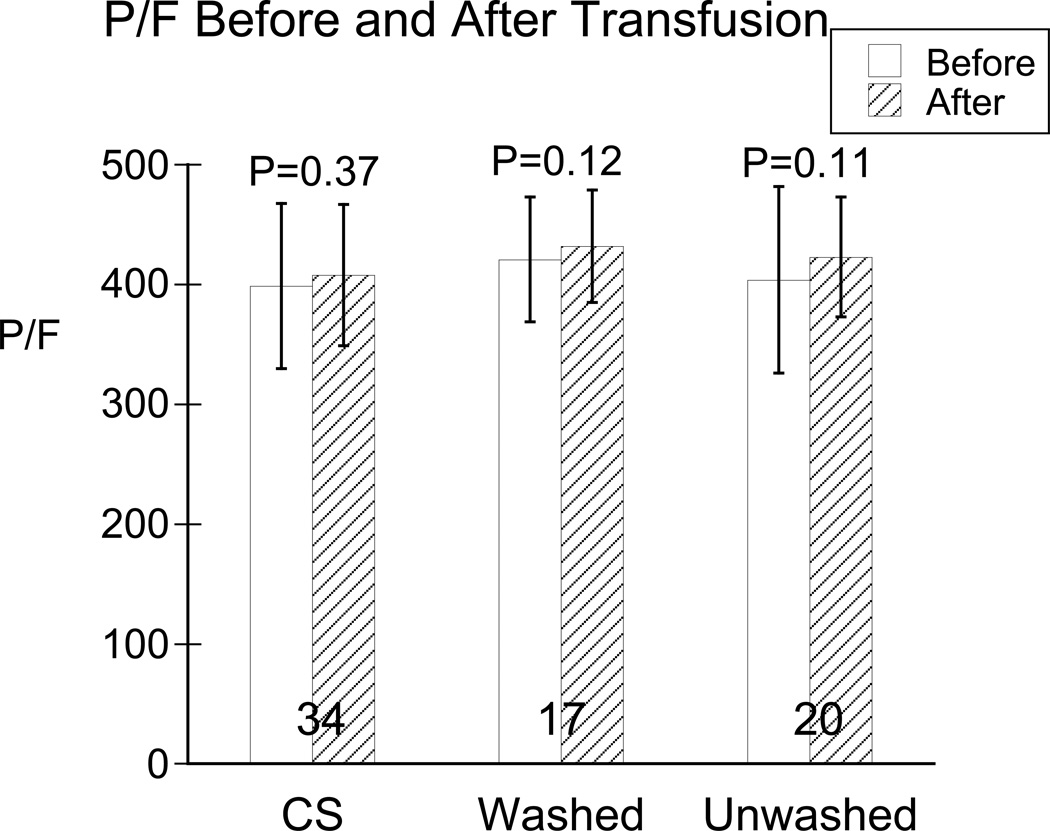
Figure 2.
P/F (PaO2/FIO2) before (unfilled bars) and after (diagonal-filled bars) in the three transfusion groups: cells saver (CS), washed and unwashed allogeneic erythrocytes. Data are mean ± SD, with “n” for each group show at the base of the bars. P values are those comparing P/F before to after transfusion within each group. There were no statistical differences between groups before or after transfusion or for changes from before to after transfusion.

