
Figure 3.
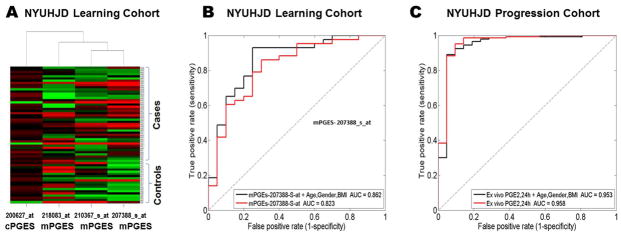
Prostaglandin E synthase mRNA is elevated in SKOA patients. A) Hierarchical clustering of NYUHJD learning cohort SKOA cases and non-OA controls based on prostaglandin E synthase U133A probe sets. B) Receiver operating characteristic (ROC) curve of membrane PGE synthase (Affymetrix U133A array probe sets (207388_s_at, 200627_at, 210367_s_at, 218083_at) for distinguishing NYUHJD Learning cohort SKOA cases from non-OA controls with and without age, gender and BMI. The curve line depicts the AUC in the 10-fold cross validation repeated 100 times. The dotted line represents the ROC curve of null model AUC (0.5). C) ROC curve of plasma PGE2 levels from ex vivo blood PBL cultures distinguishing NYUHJD progression cohort SKOA cases from non-OA controls with and without age, gender and BMI. The curve line depicts AUC in the 10-fold cross validation repeated 100 times.