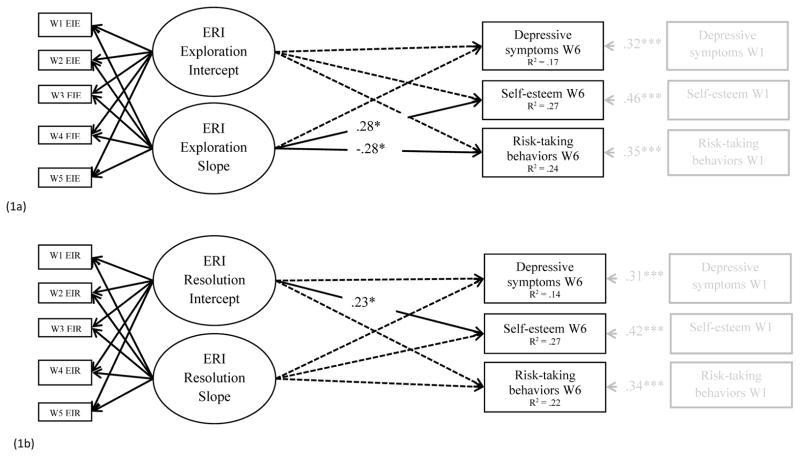
Figure 1.
Figure 1a and 1b. Latent Growth Models of (1a) W1 to W5 ERI exploration and (1b) W1 to W5 ERI resolution predicting W6 outcomes, controlling for W1 outcomes, adolescents’ age at W1, and nativity. Standardized beta coefficients are presented. Dashed black lines are non-significant paths. W1 = Wave 1; ERI = Ethnic-racial identity; EIE = ERI Exploration; EIR = ERI Resolution. Fit indices for Model 1a: χ2 (40) = 29.77, ns, CFI = 1.00, RMSEA =. 00; Model 1b: χ2 (40) = 40.69, ns, CFI = .998, RMSEA =. 01. *p < .05, ***p < .001. CFI = Comparative fit index; RMSEA = Root mean square error of approximation.

