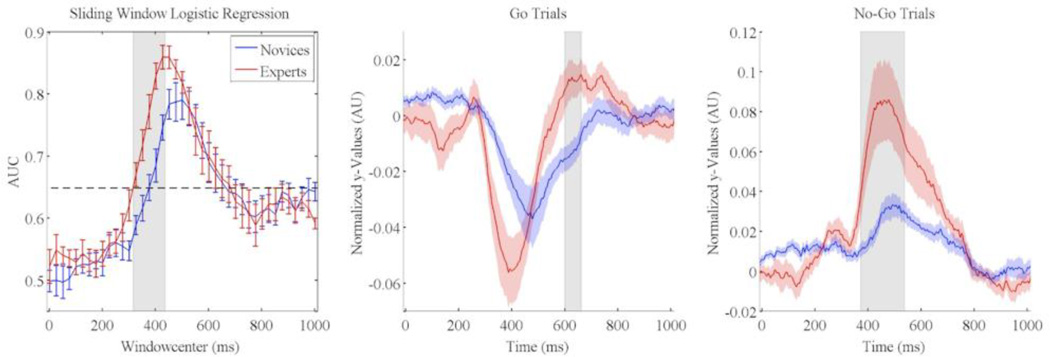
Figure 2.
Stimulus-locked EEG discrimination results for Correct Go versus Correct No-Go trials for Novices (blue) and experts (red) (Left panel). Each AUC curve shows the mean and standard error bars computed using leave-one-out discrimination. The significance line (dotted) is corrected for multiple comparisons (line at p=0.05 Bonferonni corrected for 41 time window comparisons). Grey shading indicates which time points showed a significant difference between experts and novices (independent groups t-test at each window and an FDR correction for multiple windows). Stimulus-locked averaged normalized y-values for Go and No-Go trials are plotted in the middle and right panels. Grey shading indicates which time points showed a significant difference between experts and novices (p<0.05 FWE corrected).

