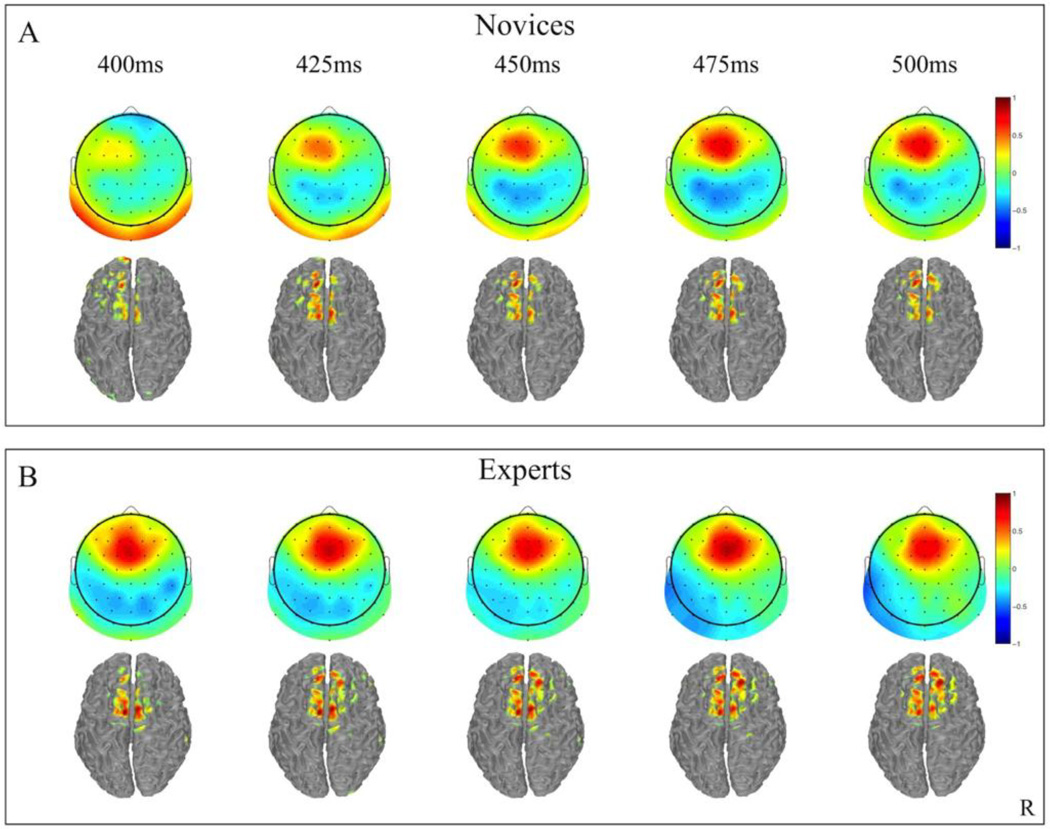
Figure 3.
Group averaged stimulus-locked forward models (aτ), shown as scalp maps and cortical distributions, for novices (A) and experts (B). Only behaviorally correct Go and No-Go trials are used to estimate these forward models. Red indicates areas with stronger positive weighting for No-Go trials and blue shading indicates areas for more positive weighting for Go trials. The center time of each window is given above each plot.

