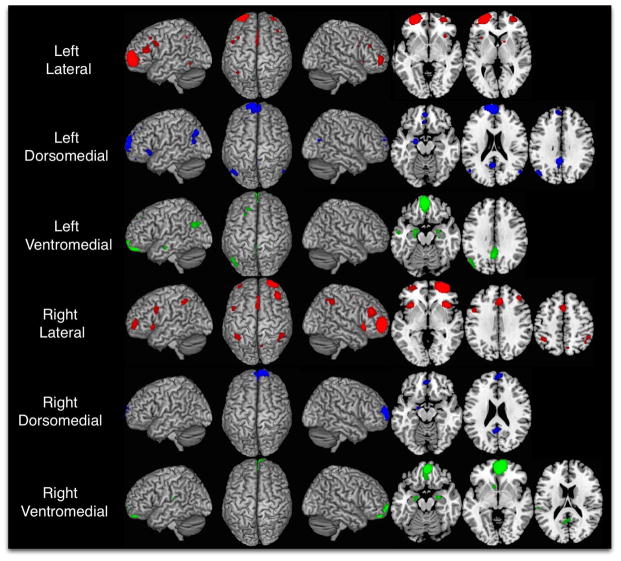
Figure 3.
Meta-analytic connectivity modeling (MACM) was performed on each of the ensuing clusters resulting from the preferred K-means clustering solution as indicated in Table 1. MACMs identify regions that commonly co-activate with the particular seed region. Right and left dorsomedial, ventromedial, and lateral clusters are shown in blue, green, and red, respectively. Cluster-level corrected threshold of P < 0.05 (cluster-forming threshold at voxel-level P < 0.001).

