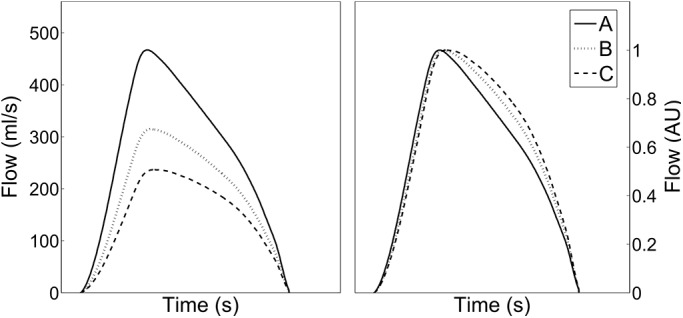
Fig 1. Changes in the shape of the modeled flow wave and the resulting stroke volume SV (ml) for a given heart rate HR and blood pressure level depending on arterial compliance Ca (ml/mmHg) and systemic vascular resistance SVR (mmHg*s/ml).

Left: real scale, right: normalized to a height of 1 arbitrary unit (AU). Parameter values for A (Ca = 0.8, SVR = 1.0, SV = 99), B (Ca = 1.0, SVR = 1.4, SV = 71) and C (Ca = 1.2, SVR 1.8, SV = 55).
