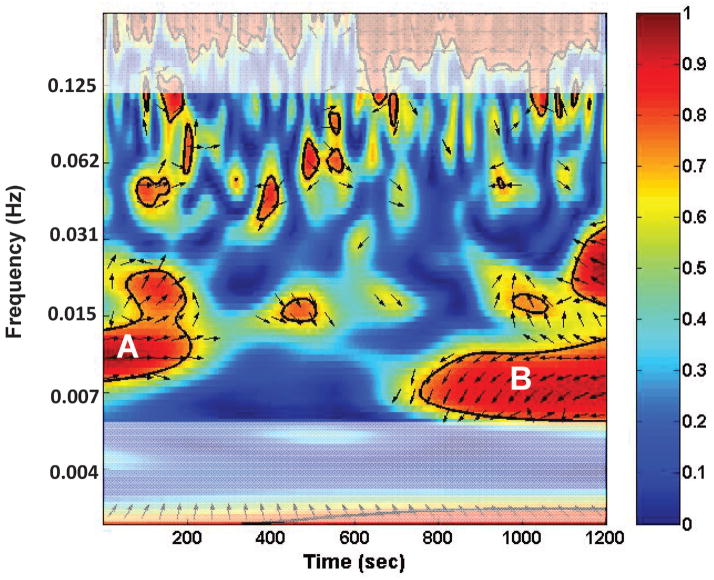
Figure 1.
Example of a cross wavelet transform (CWT) plot for INSI and THALI of a TLE patient using the Morlet wavelet. The R2 is denoted by color (0–1) and the θ is indicated by the direction of the arrow. The white shading represents frequencies temporally filtered in the preprocessing for functional connectivity. The horizontal axis is the time during the scan. The vertical axis represents frequency of BOLD oscillations. This example shows that in the first 200 seconds of the scan, the highest connectivity between the two regions occurs at a frequency of approximately 0.01 Hz (A); while later in the last 400 seconds of the scan, the highest correlation occurs at a frequency of about 0.007 Hz (B).

