Figure 3.

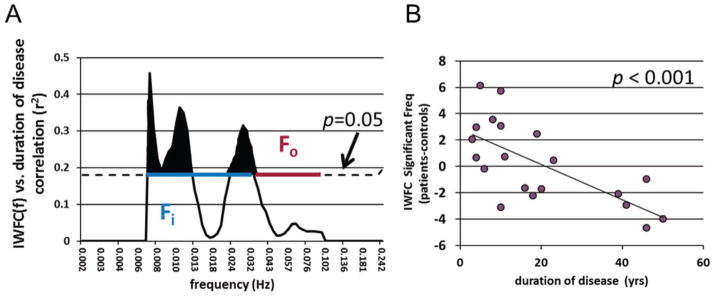
IWFC(f) frequency analysis. (A) Correlation between IWFC(f) (pat-con) vs. duration of disease at each frequency. Dotted black line indicates r2 value over which p < 0.05. Shaded black areas show frequencies for which this correlation is statistically significant. The blue line represents the frequency band of interest (Fi), while the red line denotes the other frequencies (Fo) used for thalamus segmentation. (B) IWFC averaged only for significant frequencies shown in A (0.0067–0.013 Hz and 0.024–0.032 Hz). Correlation to duration of disease is higher than that of all frequencies shown in Figure 2B (r = −0.505 for all frequencies vs. r = −0.683 for significant frequencies only). Solid line represents linear trendline. Each point in (B) represents the IWFC of each patient minus the age and gender matched healthy control (pat-con).
