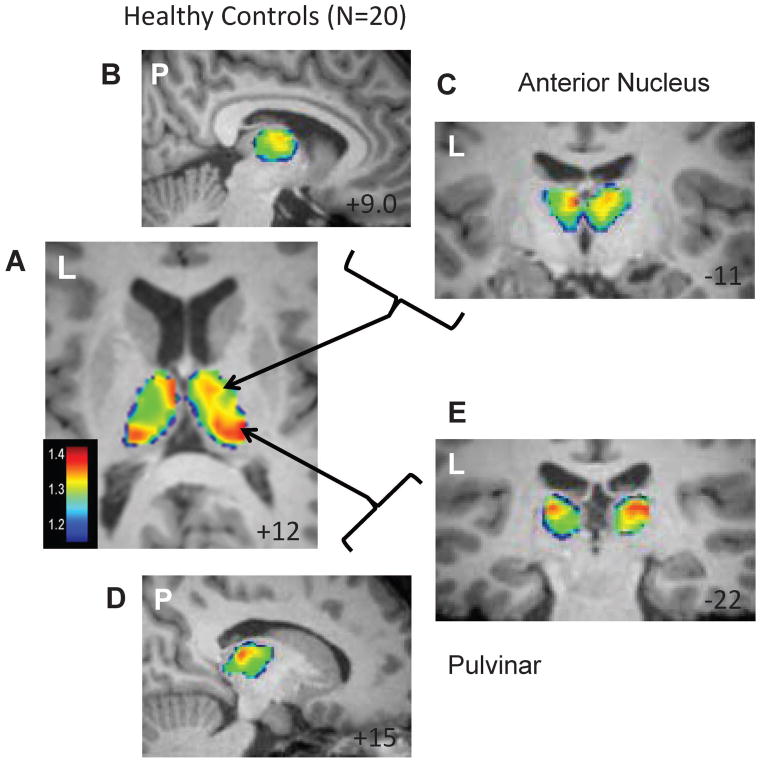
Figure 4.
Frequency segmentation of the thalamus in healthy controls. Average of Fi/Fo power across 20 healthy control subjects. (A) Axial slice showing increased power in bilateral anterior nucleus and pulvinar regions. Increased power in the anterior nucleus region is shown in a sagittal (B) and coronal (C) section. Increased power in the pulvinar region is shown in a sagittal (D) and coronal (E) section. Left (L) or posterior (P) side of the image is indicated in each. MNI template slice location is given in the bottom right corner in mm.

