
Figure 6.
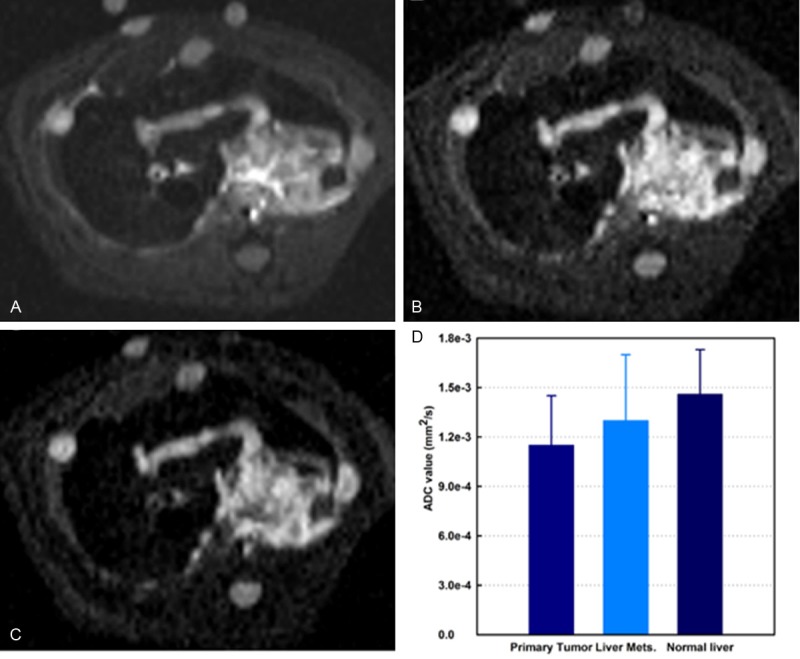
Representative axial DW-MRI images from rat DSL model. Stejskal-Tanner DW spin-echo sequence; b-values = 0, 500, and 800 s/mm2 for A-C; respectively. Quantitative ADC measurements are shown in D. There was significant differences found between both primary tumors and liver metastases and normal liver tissues (all p < .05). Mets = metastases.