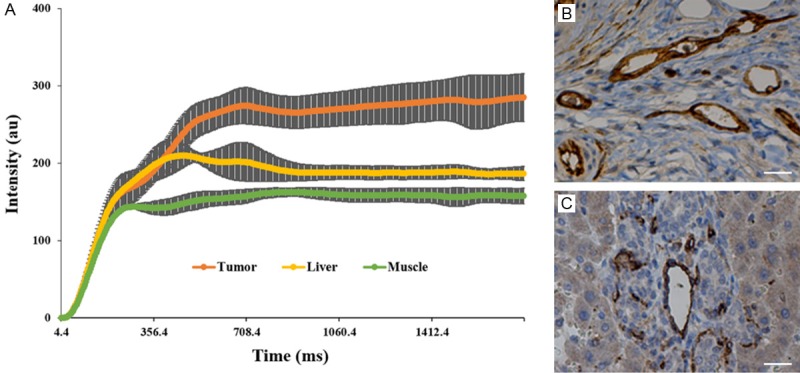
Figure 7.

Representative in vivo contrast agent tracer concentration versus time curves for three tissues of interest (primary tumor, normal liver tissue, and skeletal muscle, SM) (A). Primary tumors demonstrated significantly greater contrast uptake compared to normal liver tissue and SM. (B, C) are representative CD34 slices of the primary tumor and the normal liver tissue. SM = skeletal muscle. Scale bar in (B, C) = 50 µm.
