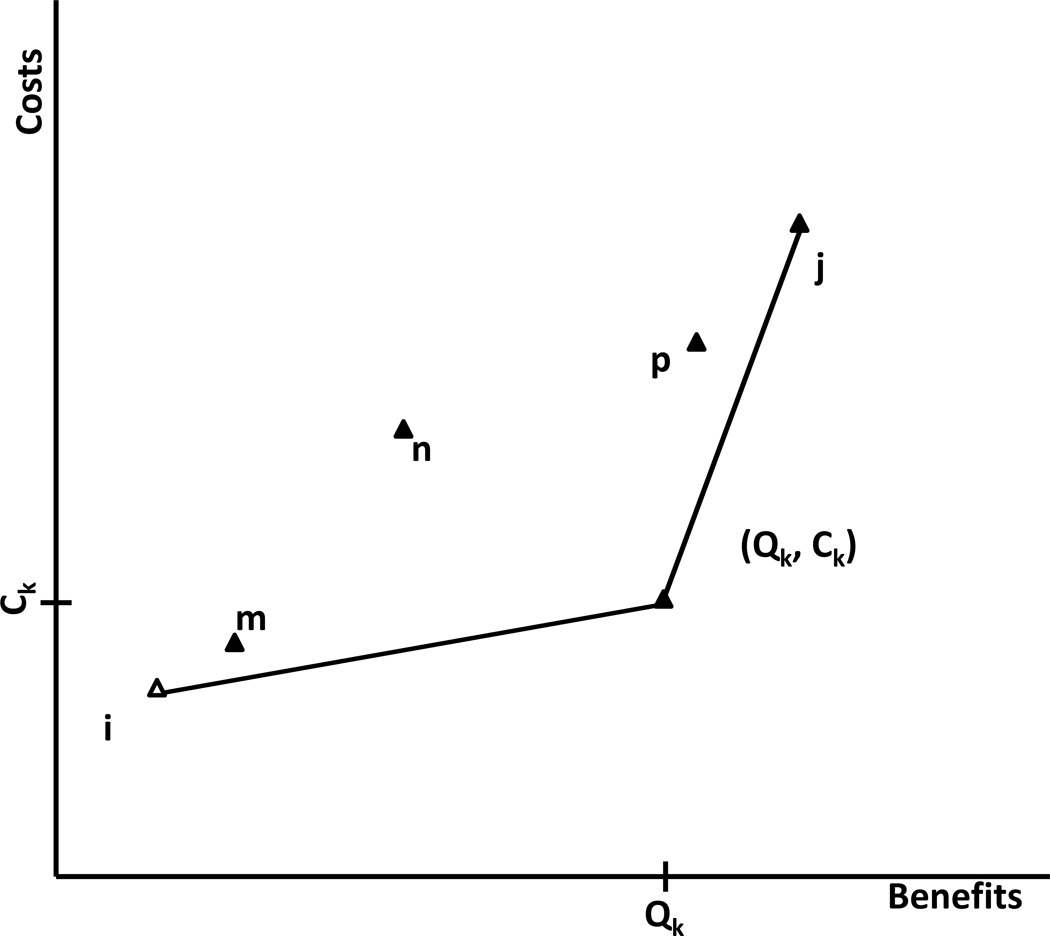
Figure 1. Example Cost-Effectiveness Plane.
Strategies are plotted by cost and benefit (strategy i has cost Ci and benefit Qi) on a cost-effectiveness plane. In this example, strategies i, j, and k lie on the cost-effective frontier (represented by the solid line) and strategy n is strictly dominated (requires higher costs and less benefit than strategy k) while strategy m and p are dominated by extended dominance.

