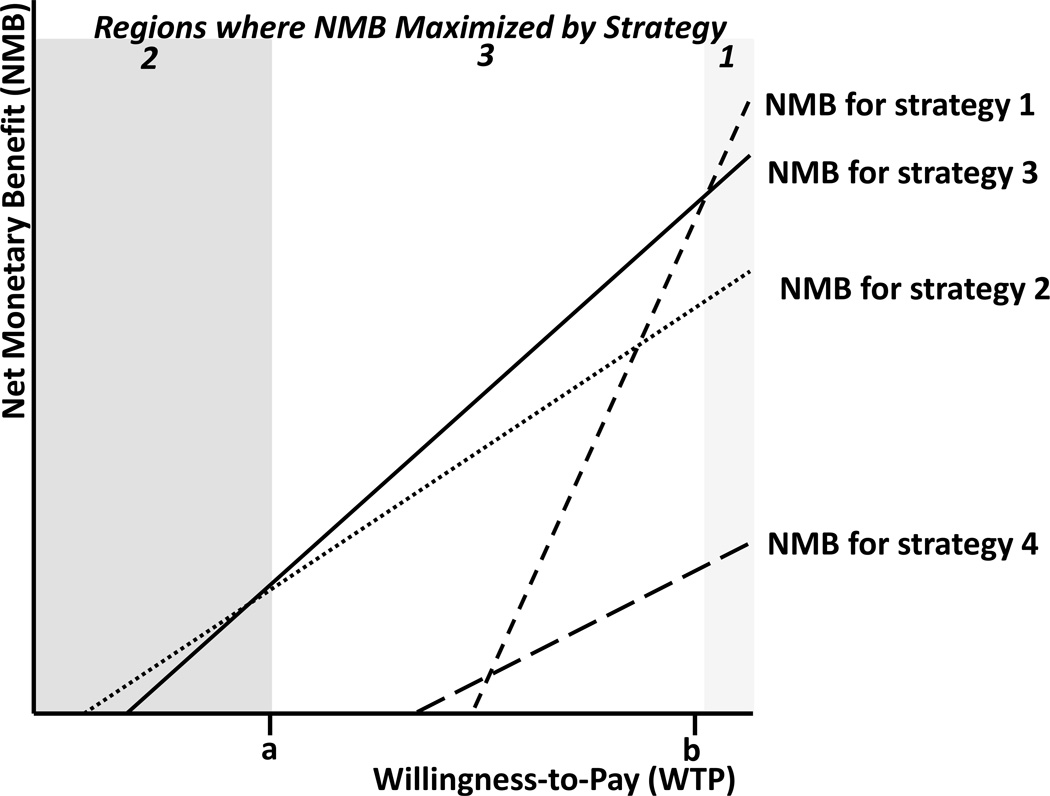
Figure 2. Hypothetical NMB versus WTP plot for Four Strategies.
Strategy 2 maximizes NMB for WTP levels between 0 and a, and strategy 3 between a and b, and strategy 1 for WTP levels above b. Strategies 1, 2, and 3 are on the cost-effective frontier, and strategy 4 is dominated. Since only a discrete set of WTP levels are considered with our method, finding the strategy that maximizes NMB at all intersections of NMB lines (equivalent to WTP levels at the pairwise ICERs) will ensure that we capture all and only those strategies on the frontier. (Not testing a WTP level between a and b would result in the omission of strategy 3, for example.) Note that the magnitude of the y-intercepts of each line represent that strategy’s costs, the x-intercept the average effectiveness ratio (cost / benefits), and the slope equal to the benefits.

