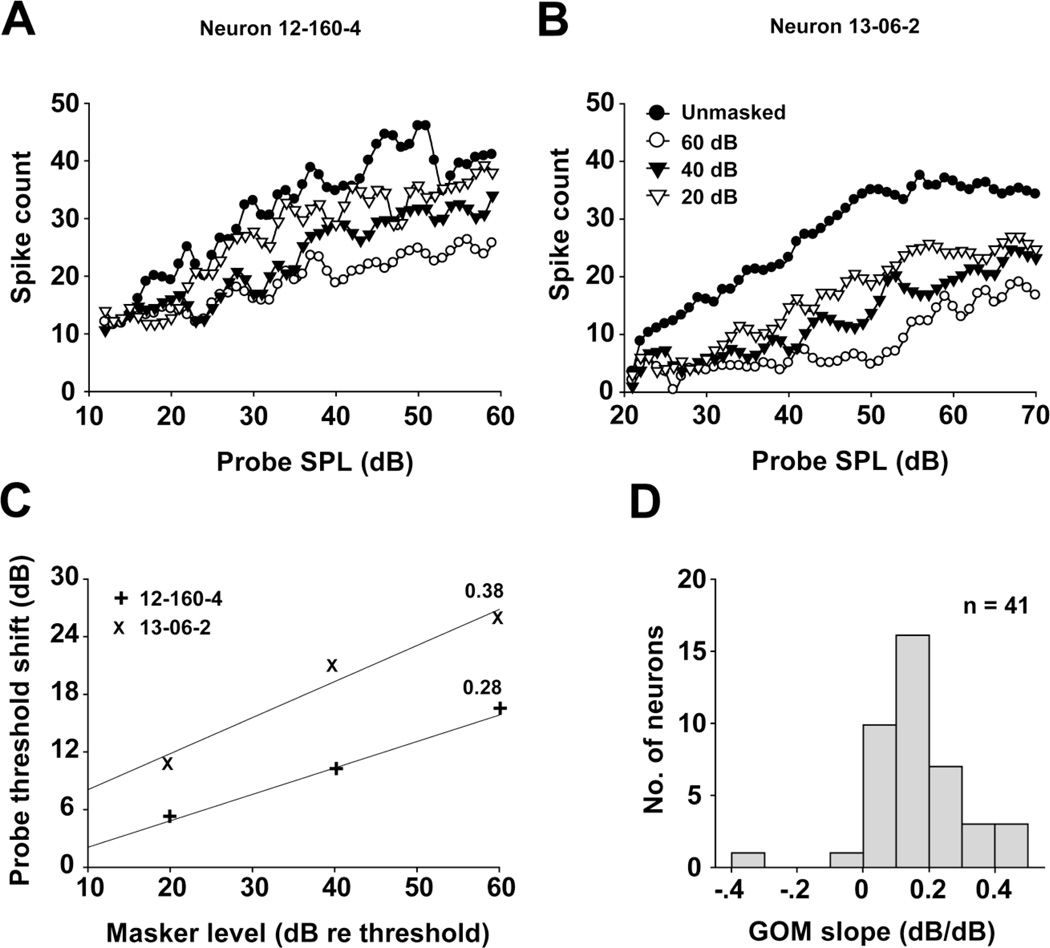
Fig. 4.
a, b Probe rate-level function dependence on masker level for two MNTB units (neuron 12-160-4: CF=25 kHz, threshold=17 dB SPL and neuron 13-06-2: CF=1.1 kHz, threshold=29 dB SPL). Masker levels (above the threshold) are indicated in panel b. c Growth of Masking (GOM) functions for the same two units. Solid lines are fitted to each set of data points to calculate the slopes (indicated by the value next to each line) of the GOM functions. d Distributions of the GOM slopes for the 41 recorded MNTB units in the sample.

