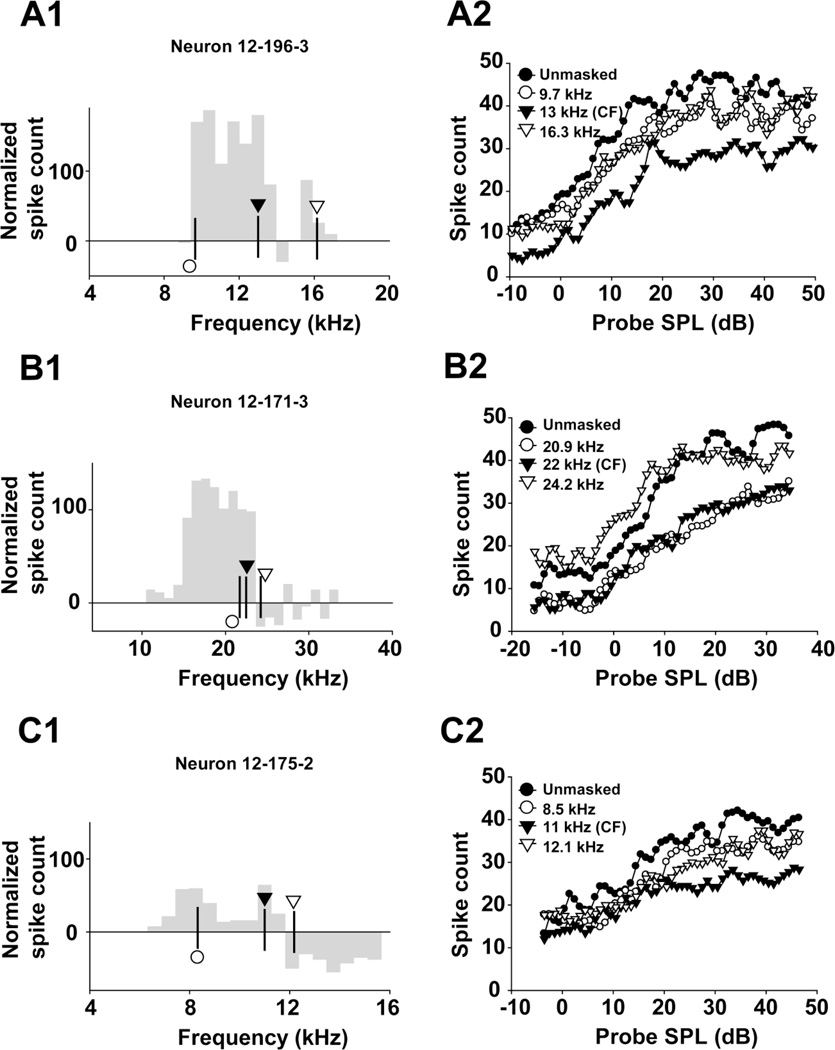
Fig. 6.
Panels in the left column (a1, b1 and c1) depict the excitatory and inhibitory regions determined from isointensity functions of three units recorded 40 dB above threshold. Spike count is displayed relative to the spontaneous rate of the unit, so that a spike count of 0 indicates the sound-evoked firing equals the unit’s spontaneous rate, positive spike count values represent an excitatory region, and negative spike count values represent an inhibitory region of the unit’s RM. Symbols indicate the selected masker frequencies; the actual frequencies are provided in the corresponding panels in the right column. Right panels (a2, b2 and c2) show the effects of masker with various excitatory or inhibitory frequencies on the responses of the same three MNTB units.

