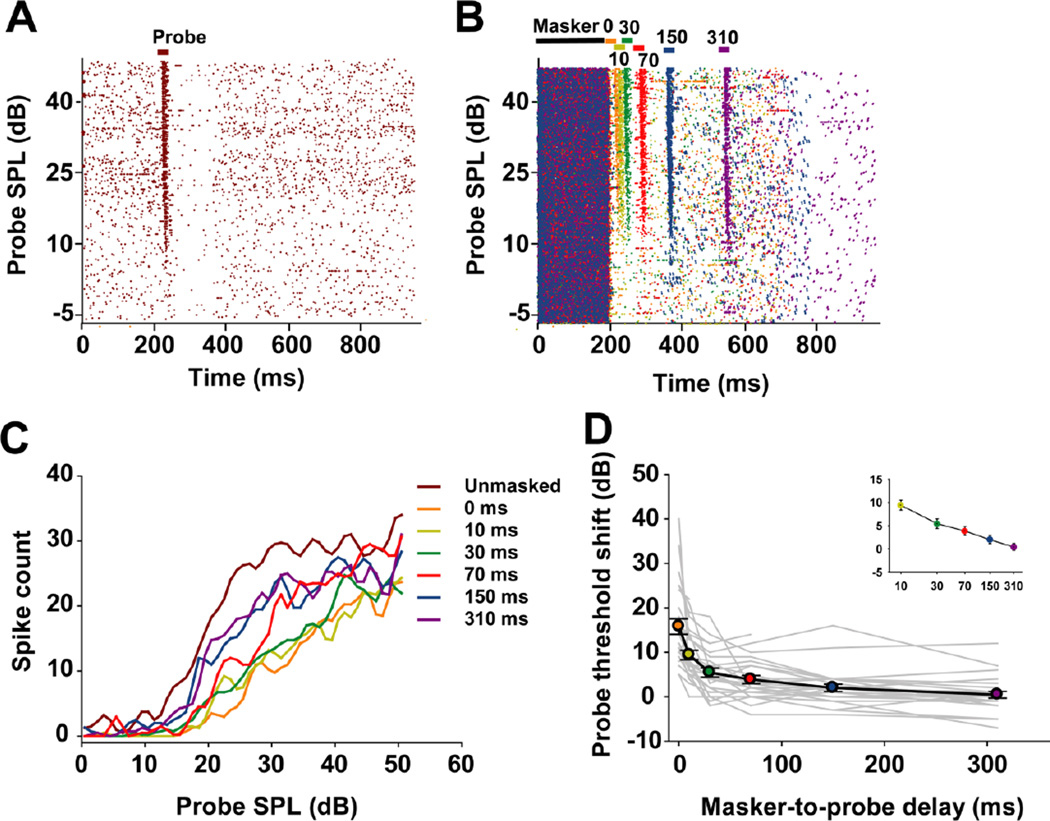
Fig. 8.
a Unmasked responses of a typical MNTB unit (neuron 12-173-3: CF=9 kHz, threshold=12.5 dB SPL). b Masked responses of the same unit, with the masker preceding the probe by different masker-to-probe delays, represented by specific colors. c Probe rate-level functions for this unit with masker-to-probe delays ranging from 0 ms to 310 ms. d Threshold shift plotted over masker-to-probe delays for the sample of 29 recorded neurons. Individual units are represented by gray lines; the average (mean ± SEM) probe threshold shift across the population is depicted by the black line. Colored circles correspond to the various masker-to-probe delays. Inset: The recovery of the threshold to the baseline value followed a linear decay in log time with increasing masker-to-probe delays.

