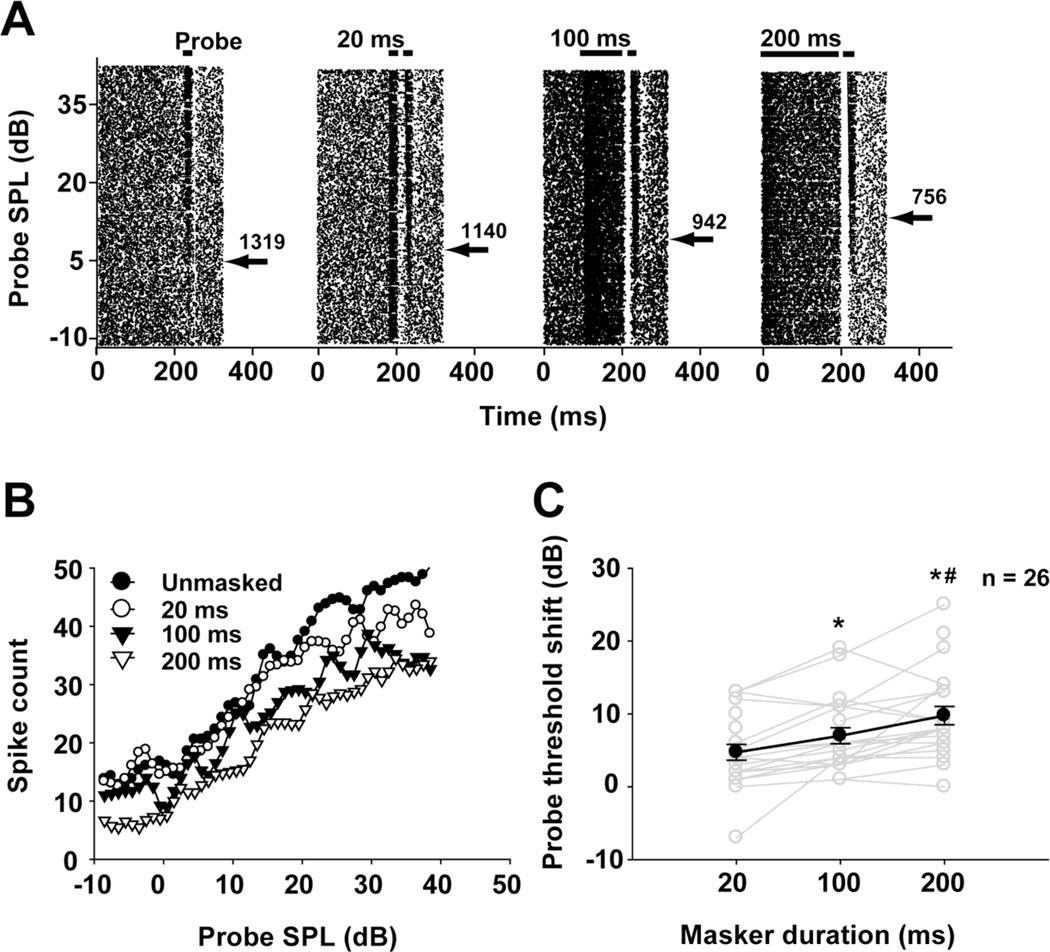
Fig. 9.
a Unmasked and masked responses of a typical MNTB unit (neuron 12-176-1: CF=10 kHz, threshold=5 dB SPL) under different masker durations. Total spike counts of responses to stimuli with intensities above the probe threshold (indicated by the arrow) are shown next to each spike-time raster plot. b Probe rate-level functions for the same unit determined under different masker durations. c Threshold shift across the sample of 26 recorded units with different masker durations. Individual units are represented by gray lines, and the average (mean ± SEM) probe threshold shifts under different masker durations are represented by the dark line with filled circles. *: p < 0.05; compared to the 20 ms masker condition; #: p < 0.05 compared to the 100 ms masker condition.

