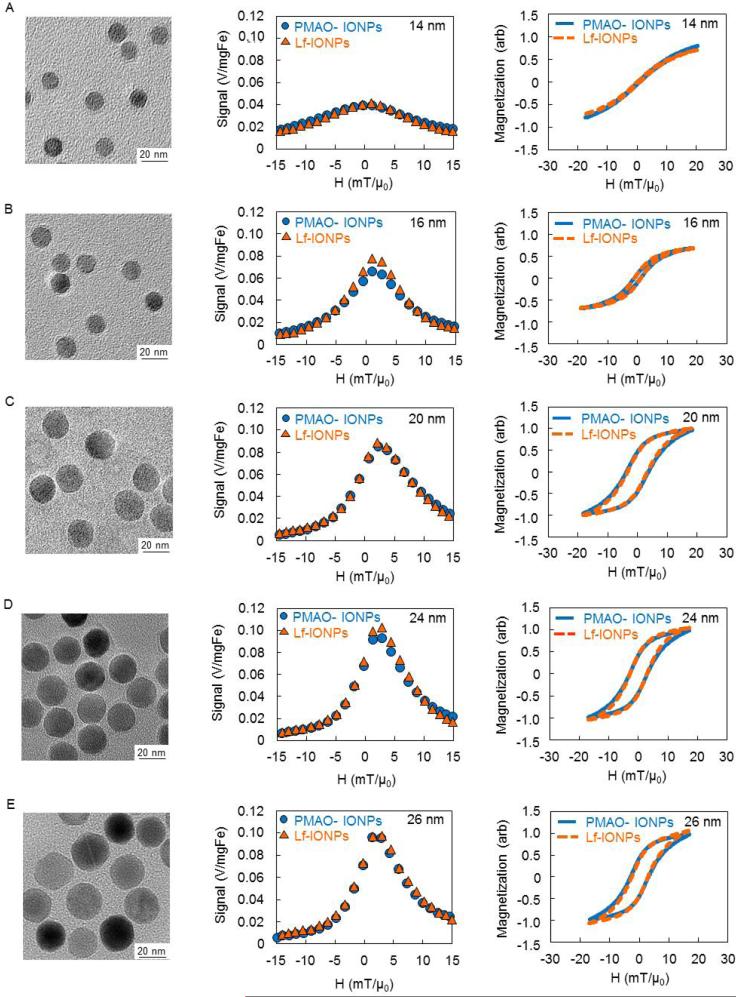
Fig. 2.
TEM images, MPS signals, and integrated ac magnetization curves of PMAO-IONPs and Lf-IONPs with core diameters of (A) 14 nm (14nm-Lf-IONPs), (B) 16 nm (16nm-Lf-IONPs), (C) 20 nm (20nm-Lf-IONPs), (D) 24 nm (24nm-Lf-IONPs), and (E) 26 nm (26nm-Lf-IONPs). The signals were divided by the amount of iron in each sample, and ac hysteresis loops were calculated by integration of the MPS signal (dm/dH). The MPS signals remained unchanged and independent of their coating compositions (PMAO or lactoferrin) for each core diameter.

