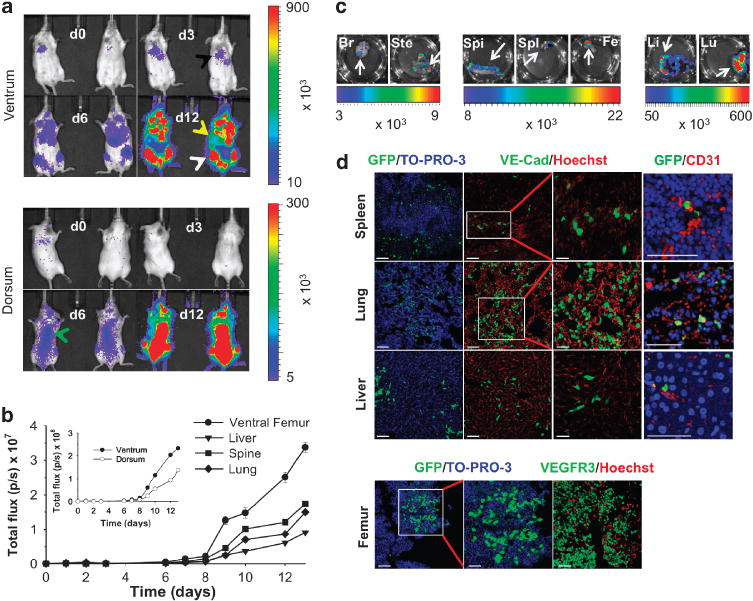
Figure 1.

Serial BLI monitoring of human leukemic cell migration in untreated animals with correlative histology. (a) Serial in vivo monitoring of luc + /GFP + HL-60 cells in SCID/Beige mice over a 12-day interval p.i. Representative in vivo ventral and dorsal BLI images acquired on days 3, 6 and 12 p.i. (lung, black arrow; liver, yellow arrow; femur, white arrow; spine, green arrow). Data indicated as mean flux values (p/s ± s.d.). (b) Time series of average BLI flux values for femur, liver, spine and lungs in individual mice (mean p/s ± s.d.). Inset shows average whole-body flux values for the dorsum and ventrum. (c) BLI of harvested ex vivo tissues. (d) Immunofluorescence characterization (Zeiss LSM 510 Meta Confocal Microscope with EC-Plan Neofluor 10×/0.3 objective, AIM software) reveals GFP+ cells and endothelial cells expressing VE-cadherin, and VEGFR3 within harvested spleen, lung, liver and femur tissue with nuclear counterstaining (TO-PRO-3, Hoechst). High-resolution images of spleen, lung and liver demonstrate close proximity of GFP+ cells to CD31-expressing endothelial cells (col 4). Scale bars = 50 μm (spleen, lung, liver: cols 1, 2; femur: cols 1,3); higher magnification GFP/TO-PRO-3 (femur: 25 μm, col 2) and VE-Cadherin/Hoechst (spleen, lung, liver: 25 μm, col 3); high magnification GFP/CD31 (spleen, lung, liver: 100 μm, col 4). Br, brain; Fe, femur; Li, liver/bowel; Lu, lung; Spi, spine; Spl, spleen; Ste, sternum.
