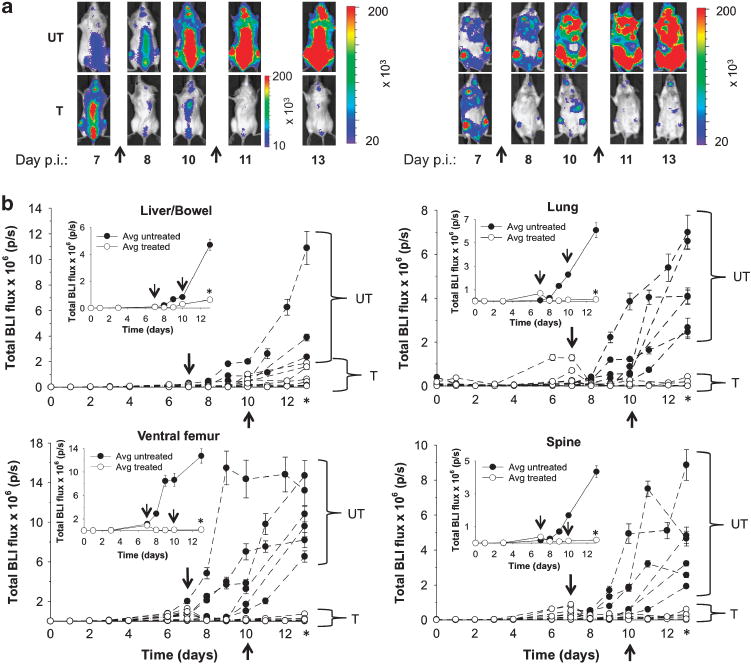
Figure 3.

In vivo response monitoring in systemic HL-60 models with BLI. (a) Representative in vivo BLI (IVIS 200, Xenogen) before (day 7) and after (days 8, 10, 11, 13) OXi4503 (25 mg/kg) or saline vehicle administration (arrows) in mice systemically inoculated with luc+ /GFP + HL-60 cells (n = 14). Ventral (right-hand side) and dorsal views (left-hand side) are shown. Color scales represent total flux values (p/s±s.d.). (b) Serial monitoring of BLI flux changes in individual animals over a 13-day period following systemic inoculation. The inset shows average flux changes for treated and control mice. Color scales represent total flux values (p/s±s.d.). Arrows represent times of drug administration. One-tailed Mann–Whitney U-tests demonstrate statistical significance (*) between cohorts of untreated (UT, n = 6) and treated (T, n = 8) mice on day 13 at the P≤0.001 level for liver/bowel (P = 0.0015), lung (P = 0.001), ventral femur (P = 0.0005) and spine (P = 0.0005).
