Figure 4.

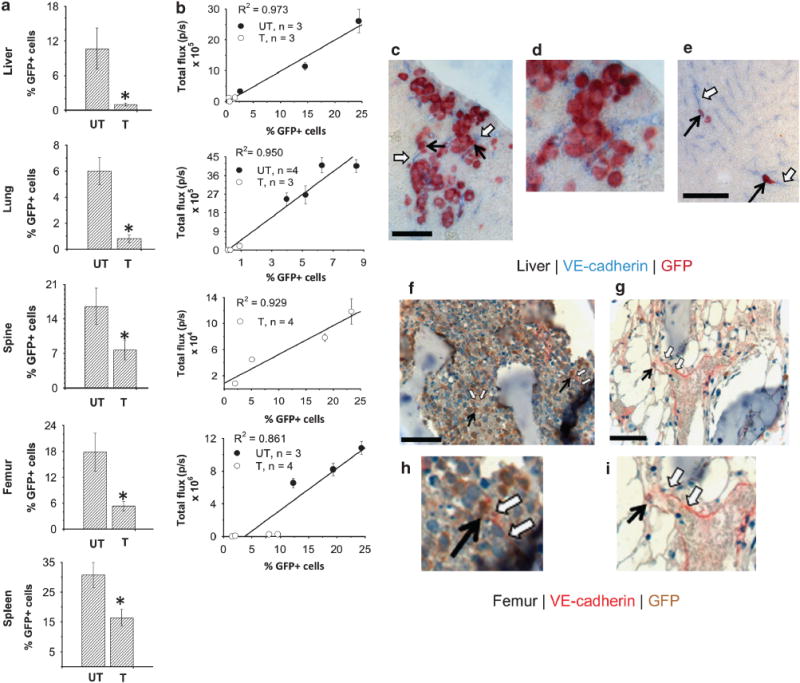
Quantitative GFP+ expression differences and co-labeling studies in treated and untreated mice. (a) Tissue-specific % GFP + -expressing cells for treated (T) and untreated (UT) mice (mean±s.e., n = 4 per group). One-tailed Mann-Whitney U-tests demonstrate statistical significance (*) at the P≤0.05 level for lung (P = 0.014) and femur (P = 0.014), and borderline significance for liver, spleen and spine (P = 0.057). (b) In vivo BLI signal versus % GFP+ expression in ex-vivo specimens using regression analysis. (c–i) Co-labeling of GFP and endothelial cells expressing VE-cadherin (Zeiss LSM 510 Meta Confocal Microscope (Carl Zeiss, Thornwood, NY, USA) with EC-Plan Neofluor 10 × /0.3 objective and AIM software (Carl Zeiss)) in untreated liver (c, d), untreated femur (f, h), and treated liver (e) and femur (g, i) sections. Endothelial cell marker: femur (red, open arrows); liver (blue, open arrows). GFP+ cells: femur (brown, solid arrows); liver (red, solid arrows). Scale bar = 25μm (c, e) and 50 μm (f, g). Representative higher-magnification images (d, h, i) reveal GFP+ cells located close to VE-cadherin-expressing endothelial cells.
