
Figure 8. Vasorelaxation to cholinergic stimulation is reduced in arteries with PVT because of lower endothelial Ca2+ responses .
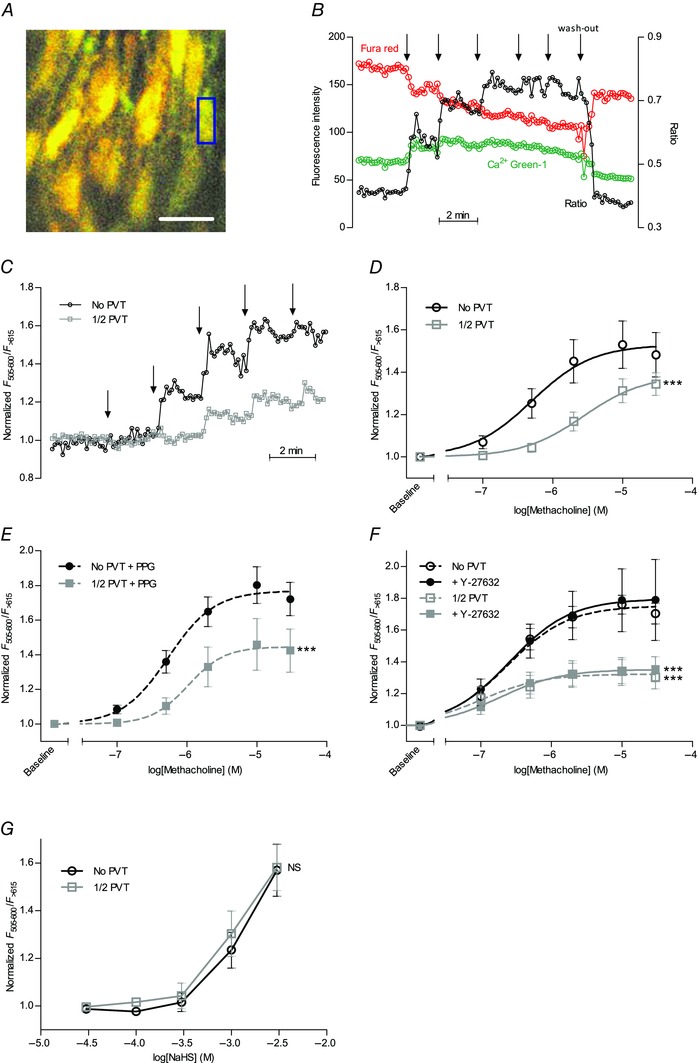
A,image of ECs in an isolated coronary septal artery loaded with Calcium Green‐1 and Fura Red. Individual ECs were marked up as regions of interest (exemplified by the blue rectangle), analysed for changes in Ca2+‐dependent fluorescence and averaged for each experiment. Scale bar represents 20 μm. B and C,original traces of relative changes in Ca2+‐dependent fluorescence ratio (between Calcium Green‐1 and Fura Red emissions) during cumulative addition of methacholine to arteries with and without PVT. At the arrows, the concentration of methacholine was increased stepwise to 100 nm, 500 nm, 2 μm, 10 μm and 30 μm, respectively. D–F,the increase in Ca2+‐dependent fluorescence upon methacholine stimulation under control conditions (D) (n = 6–7) in presence of 10 mm CSE inhibitor PPG (E) (n = 5) or with 10 μm rho‐kinase inhibitor Y‐27632 (F) (n = 6–8) was reduced in arteries with PVT compared to arteries without PVT. G,the increase in Ca2+‐dependent fluorescence upon application of the H2S‐donor NaHS was not affected in arteries with PVT (n = 5) compared to arteries without PVT (n = 6). Data were fitted to sigmoidal curve fits and compared using extra sum‐of‐squares F tests. **P < 0.01, ***P < 0.001. NS, not significantly different vs. arteries without PVT.