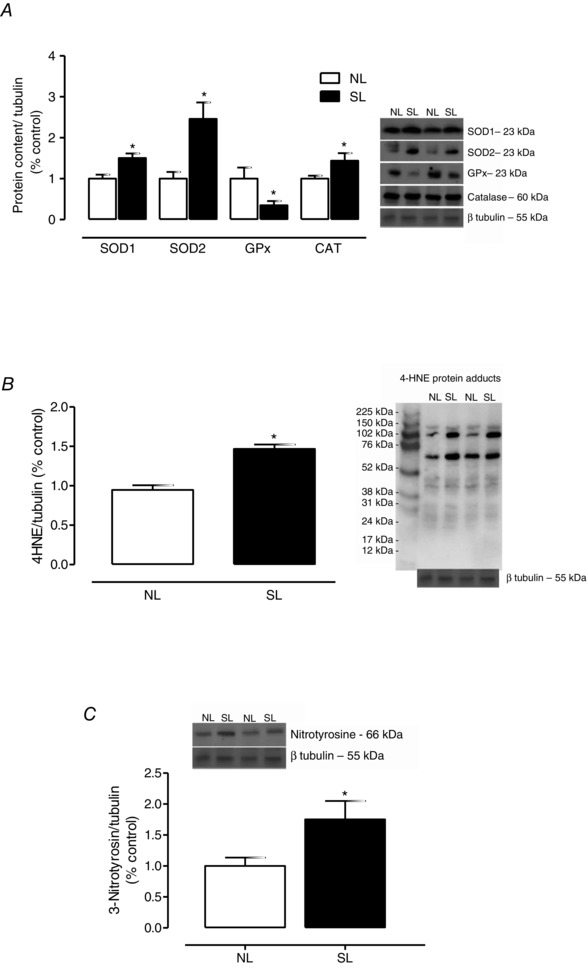
Figure 4. The effect of reducing litter size on antioxidant protein content and oxidative biomarkers in liver at 21 days old .

SOD1, SOD2, GPx and CAT protein contents (A), 4HNE protein adducts (B), and 3‐nitrotyrosine content (C) from rats raised in normal litters (NL) and small litters (SL) during lactation. The representative blots of proteins are shown next to the graphs. β‐Tubulin content was used as control loading. Results are expressed as relative (%) to the control group and as means ± SEM; n = 6–7 per group; *P < 0.05.
