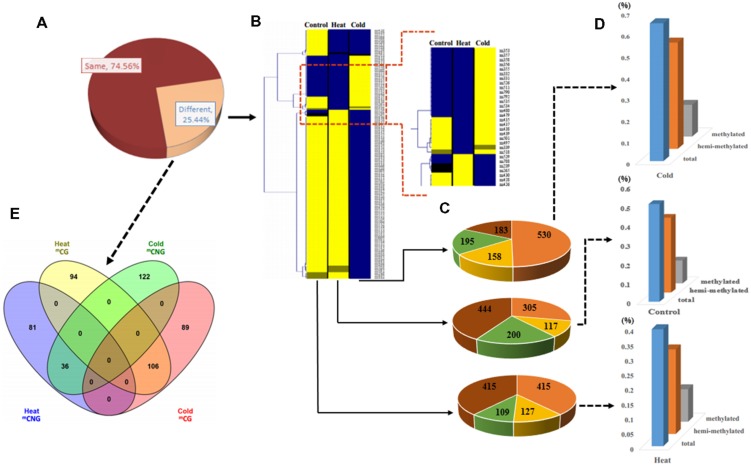
FIGURE 2.
Analysis of methylation patterns and levels in Populus simonii under heat stress, cold stress, and in the control group.
(A) The ratio of different MSAP band types: the dark red part represents MSAP bands with the same methylation pattern in heat, cold, and control groups; the orange part represents MSAP bands with different methylation patterns in heat, cold, and control groups. (B) Hierarchical clustering analysis of pattern of MSAP markers:  represents unknown methylation pattern;
  represents hemi-methylated pattern;
  represents methylated pattern;
  represents unmethylated pattern. (C) The number of four MSAP patterns:
  represents unknown methylation pattern;
  represents hemi-methylated pattern;
  represents methylated pattern;
  represents unmethylated pattern. (D) Relative methylation level, relative hemi-methylated level, and relative total methylation level (see Materials and Methods for calculations). (E) Venn diagram showing the number of heat stress and cold stress loci with stress-specific DNA methylation.

