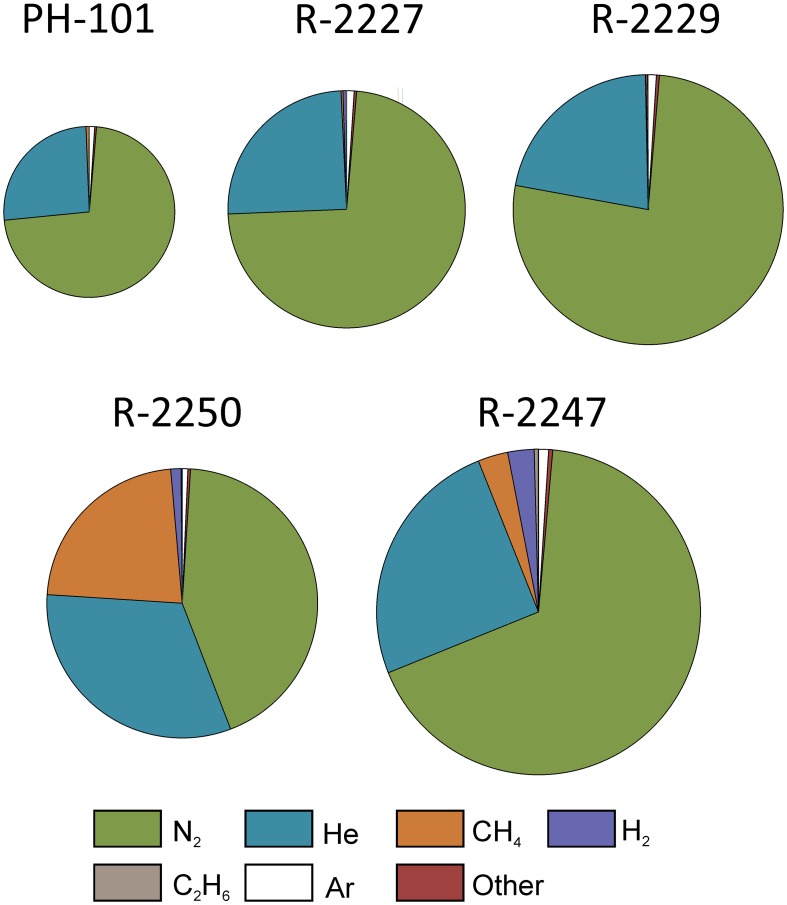
Figure 3.
Relative compositions of dissolved gases in the drill holes sampled in the Pyhäsalmi mine. Areas of the charts are proportional to the average gas volumes measured in each of the drill holes, with the largest chart (R-2247) corresponding to a gas volume of 90 mL per 1 L of groundwater. Other gases include O2, CO2, propane, butane, and pentane (Supplementary Table 2).

