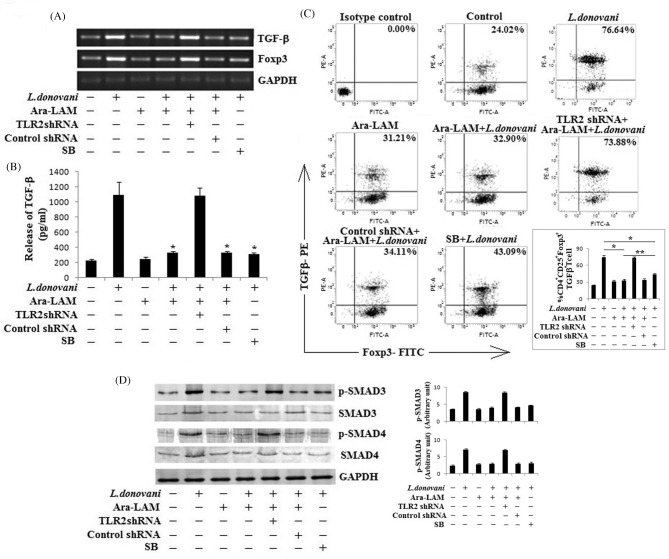
Figure 4.
Effect of Ara-LAM treatment on TGF-β signaling in T regulatory cells. (A and B) BALB/c mice were pretreated with SB-431542(SB) (10 mg/kg body weight, i.v.) for 1 day or with respective shRNAs (i.v.) for 2 days followed by Ara-LAM treatment and Leishmania challenge. CD4+CD25+ Treg cells (2 × 10⁵), purified from spleen of differently treated mice (see section ‘Materials and Methods’) 4 weeks post-infection, were collected in TRIZOL for mRNA extraction and semiquantitative RT-PCR to study TGF-β and Foxp3 mRNA expression or were stimulated with SLA for 72 h, after which the cell supernatants were collected for estimation of TGF-β (B) by ELISA. Data represent means ± SD for triplicate sets. *P < 0.001 for the comparison with infected mice. (C) In a separate experiment, CD4+CD25+ Treg cells (1 × 10⁶), isolated from spleen of infected and indicated treatment groups of mice 28 days after infection, plated aseptically followed by fixation and staining for PE-conjugated TGF-β and FITC-conjugated Foxp3 as mentioned in the section ‘Materials and Methods’ and analyzed by flow cytometry. Data are from one of three representative experiments. Bar diagram represents means ± SD for triplicate sets. *P < 0.001 and **P < 0.05 for the comparison with infected mice. (D) In a separate experiment, similarly isolated CD4+CD25+ Treg cells (2 × 10⁶) were stimulated with SLA for 30 min, followed by cell lysis and western blotting with antibodies against p-SMAD3, p-SMAD4, SMAD3, SMAD4 and GAPDH as described in the section ‘Materials and Methods’. The data are representative of three independent experiments yielding similar results. Bar diagram represents densitometric fold change in arbitrary unit.

