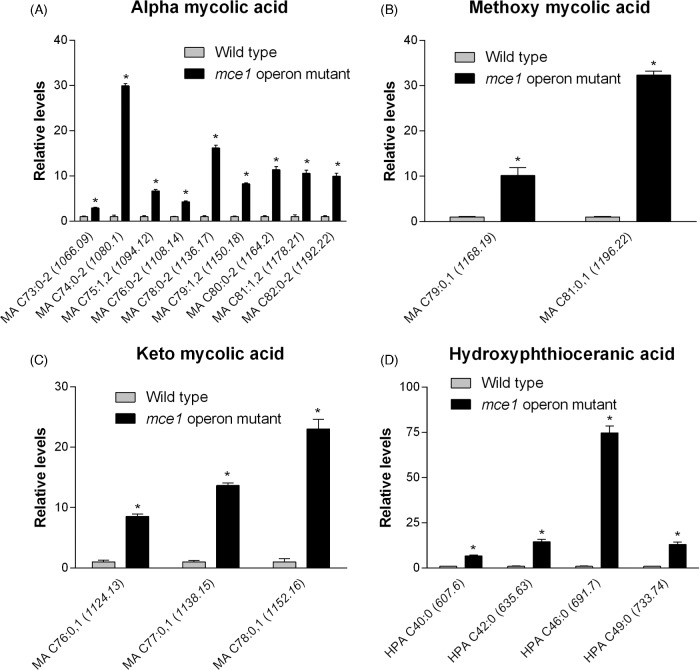
Figure 3.
Lipid species that were increased in the mce1 mutant compared to wild-type M. tuberculosis. Bar graphs of relative levels of acyl forms of identified lipids that are significantly increased in M. tuberculosis mutant strain relative to wild type are shown. Data in bar graphs are presented as mean ± SEM; n = 3–5/group. Each lipid species is labeled as acyl length:number of unsaturation (m/z). Significance is presented as * P < 0.05 compared to wild type.

