Figure 3.
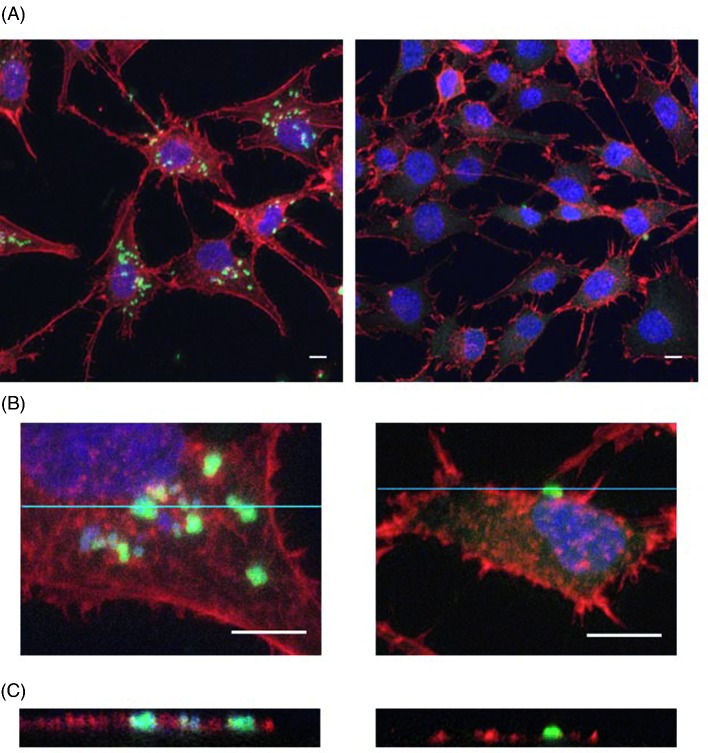
Bacterial internalization assessment by confocal microscopy. Immunofluorescence stainings of F-actin (red, phalloidin), nuclei (blue, DRAQ5) and bacteria (green, polyclonal anti S. aureus or E. coli), performed after 2 h of coculture of MG-63 cells with the Saclin strain or with the OII E. coli strain Ec2 (MOI of 10:1) and 4 h of incubation with 100 μg mL−1 gentamicin. (A) The image on the left shows several S. aureus cells associated with the MG-63 cells, whereas very few E. coli cells were detected (image on the right). (B) Cropped images of the stacks analyzed in A confirm the presence of aggregates of S. aureus cells (image on the left) and a single E. coli cell (image on the right) in close contact with the MG-63 cells. (C) Orthogonal views derived from the blue lines of the crops analyzed in B show the intracellular location of the S. aureus cells (image on the left, green signals framed with red), whereas the E. coli cell was extracellular (image on the right, no red frame around the green signal). Scale bars: 10 μm.

