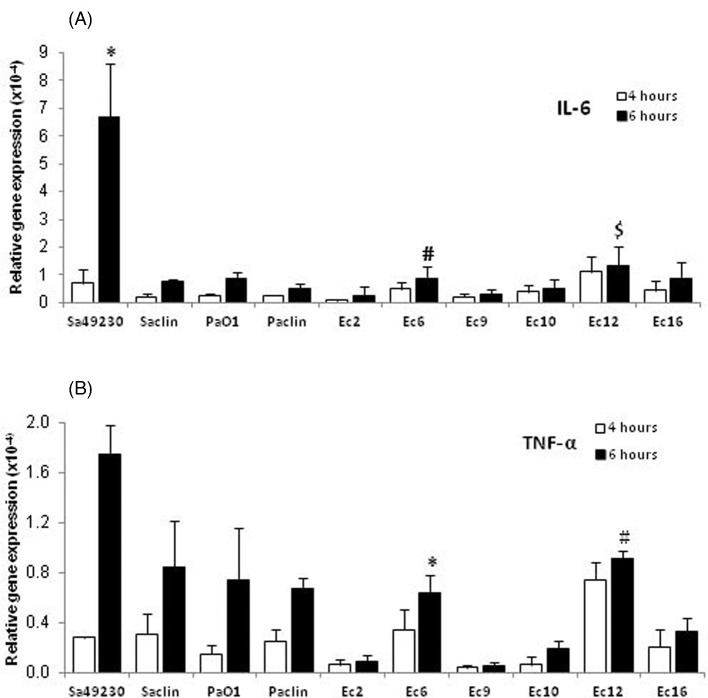
Figure 5.
Relative expression of IL-6 and TNF-α mRNAs in MG-63 cells. The cells were infected with the four control strains or six selected OII E. coli strains, for 4 or 6 h (MOI of 100:1), before total RNA extraction. Results are expressed as relative gene expression after normalization using the β-actin housekeeping gene. (A) IL-6 mRNA expression. The Sa49230, Ec6 and Ec12 strains were tested statistically with the Kruskal–Wallis test followed by a Dunn's post test. *, P < 0.05 versus Saclin, PaO1, Paclin, Ec2, Ec6, Ec9, Ec10 or Ec16 (6 h of infection); #, P < 0.05 versus Sa49230, Ec2 or Ec9 (6 h of infection); $, P < 0.05 versus Paclin, Ec2, Ec9 or Ec10 (6 h of infection). (B) TNF-α mRNA expression. The Ec6 and Ec12 strains were tested statistically with the Kruskal–Wallis test followed by a Dunn's post test. *, P < 0.05 versus Sa49230, Ec2, Ec9 or Ec10 (6 h of infection); #, P < 0.05 versus Ec2, Ec9, Ec10 or Ec16 (6 h of infection).

